More On Screening Using the MOAT Method
The Screening, MOAT study type uses a global screening method designed to qualitatively estimate the significance of individual input parameters. This sample-based approach uses the Morris one-at-a-time (MOAT) method and requires a relatively small number of COMSOL model evaluations, making it well suited for cases where there are too many input parameters to perform more computationally intensive uncertainty quantification (UQ) studies.
For each quantity of interest (QoI), the MOAT method calculates the mean and standard deviation of the MOAT values for each input parameter. These results are presented in a MOAT scatter plot, where the relative importance of input parameters is determined by ranking the MOAT means and standard deviations. A high MOAT mean indicates that the parameter has a substantial impact on the quantity of interest, while a high standard deviation suggests that the parameter is influential with strong interactions, nonlinear effects, or both.
MOAT Method Overview
To exemplify the MOAT method, consider the case of three input parameters, ,
, and
, where we aim to compute the MOAT sensitivity for a function
. This function can be an analytical expression but is typically a finite element model (or another numerical model) that is computationally expensive to solve or evaluate.
First, specify the range for each parameter. Then, select a starting point by choosing a set of random values for the input parameters . A predetermined step,
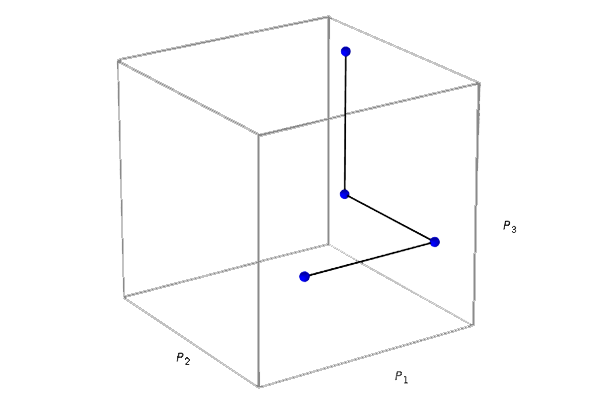
, changes the value of each input parameter while keeping the other parameter values constant. This process is automatically repeated until all input parameter values have changed. This sequence of changes is called a trajectory and is shown in the figure below.

An example of the first trajectory as used in the MOAT method where the value for each input variable is changed by a predetermined step while the other input variables remain constant.
The goal of such a trajectory is to compute global perturbations to the model while requiring a minimal number of model evaluations. The MOAT method is economical in the sense that the end points of one step of a trajectory are used as the starting point for the next step, and in this way minimize the number of model evaluations.
For each step, a finite difference, called an elementary effect, is computed. A trajectory includes model evaluations (each vertex of a trajectory) that can be used to compute
elementary effects. In the MOAT method, the starting point of a trajectory
is randomly selected and each input parameter is perturbed while keeping the other parameters constant. The elementary effects of a trajectory are computed as:
and
where the model evaluation of one step is reused in the next step.
Since the sensitivity of a model can vary across different regions of the input space, the MOAT method uses different starting points, enabling the exploration of a wider range of input space. This helps avoid local bias and ensures that the calculated MOAT mean and standard deviation reflect the global behavior of the model. After the elementary effects of the first trajectory have been computed, the starting point of the second trajectory
is chosen, and its elementary effects
,
, and
are computed and stored. The figure below shows an example of a second trajectory in this process. In the COMSOL implementation, the trajectories are carefully selected to be well dispersed in the sample space in order to better explore the input space.

An example of the second trajectory in the MOAT method.
This is then repeated times, where
is called the repetition number. The total number of model evaluations for the MOAT method is
. For the Screening, MOAT study type, the default value is
. In this example, where
, we have that
.
MOAT Mean and Standard Deviation
For each quantity of interest, the MOAT method computes the mean and standard deviation for each input parameter, using the results from the elementary effects calculations.
The MOAT mean for each input parameter is computed as:
and the MOAT standard deviation for each input parameter is computed as:
where is the signed mean value.
The MOAT mean is computed based on the absolute values of the elementary effects in order to avoid accidental cancellations.
The mean and standard deviation values are presented in a MOAT scatter diagram, as shown in the figure below.

An example of a MOAT scatter diagram.
Probability Distributions
The MOAT sampling algorithm described above applies to uniformly distributed input parameters. Without loss of generality, we can assume these parameters are defined on the unit cube , where
is the number of input parameters. Uniformly distributed parameters on other intervals can be mapped to the unit cube using a simple linear transformation. If the probability distribution function is not uniform, the MOAT sampling points are first computed in the unit cube, as described above, and then nonlinearly mapped to the actual distribution space. The elementary effects are then computed in this mapped space. The lower and upper bounds of the distribution (see Part 3 are used to constrain the sample space.
Analysis of the Screening Results
The ranking of the mean and standard deviations indicates the relative importance of the input parameters. The ranking is as follows:
- A high MOAT mean value implies that the parameter significantly influences the QoI.
- A high standard deviation suggests that the parameter interacts strongly with other parameters, exhibits nonlinear effects, or both.
Note that the MOAT method is designed to provide a preliminary, qualitative assessment of input parameter importance rather than precise quantitative measures. The specific values of the mean and standard deviation of the elementary effects should not be interpreted in isolation or as exact measures. Instead, the relative sizes of these values should be used to draw conclusions about the relative importance of the input parameters. Larger mean values indicate more influential parameters, and larger standard deviations suggest greater interaction effects or nonlinear responses.
A Polynomial Example
To build some intuition for the MOAT mean and standard deviation, let's consider an analytical example with a polynomial in five variables:
The corresponding file is available for download.
The following figure shows the MOAT scatter plot with the mean and standard deviation values for the variable , where
. Parameters located up and to the right in the scatter plot are more influential.

A MOAT scatter diagram for a polynomial in five variables.
The influence of each of the different variables is summarized below.
: In this example, this variable only appears in
, which is a linear term with a relatively small coefficient.
has no interaction with any of the other variables. This value is identified in the MOAT scatter diagram by a relatively low mean value and zero standard deviation value. A variable with linear or near-linear dependency will be characterized by a zero or near-zero standard deviation value.
: This variable appears in
, a nonlinear term with a relatively moderate coefficient, and has no interaction with any of the other variables. This value is identified by a relatively low mean value but a standard deviation value that is is relatively significant due to the nonlinearity.
: This variable appears in a relatively large linear term, a nonlinear term, and the interaction term
. This value is identified by a relatively high mean value as well as a high standard deviation value.
: This variable only appears in the interaction term
. This value is identified by a near-zero mean value and relatively significant standard deviation value.
: This variable only appears in the relatively large linear term
. This value is identified by a relatively large mean value and zero standard deviation value.
- The constant term
in the polynomial has no influence over the mean and standard deviation values. In other words, if we removed the constant term, we would get the same MOAT mean and standard deviation values.
Submit feedback about this page or contact support here.


