
Do you remember your first concert? When I think of mine, I am transported back to December 30, 2007. I was sitting in a crowded, midsized theater, poster in hand. A countdown echoed around the room — five, four, three, two, one — and out came American singer-songwriter Fergie. I will always remember this day, stemming my appreciation for live music for years to come. The loudspeakers placed around the theater enabled me to hear all of the music perfectly, even from the back of the venue.
Why Optimize Loudspeaker Components?
It is important that loudspeakers perform optimally no matter where they are being used, whether it be in a home theater system, in a gym, at a family cookout, or at a concert venue. To design high-performance loudspeakers, you can optimize a variety of their components using simulation. For example, you can perform a shape or topology optimization of a loudspeaker’s dome and waveguide, magnetic circuit, and spider membrane with the COMSOL Multiphysics® software.
Let’s take a closer look at these three examples…
1. Optimizing a High-Frequency Loudspeaker Tweeter
Tweeters are a type of small, lightweight loudspeaker driver designed to generate high frequencies (~2 kHz to ~20 kHz). Fittingly, they are named after the chirping sounds birds make, tweet tweet.
An ideal tweeter driver consists of a flat sensitivity curve and sounds the same, no matter the position of the listener (it has an omnidirectional radiation characteristic). However, cone breakup and beaming effects, inherent to all loudspeaker driver designs, will negatively impact the quality of a tweeter. The laws of physics simply set a limit to how ideal a tweeter can be. An optimal tweeter design will have a flat response and as much spatial coverage as possible.
By changing the shape of a tweeter’s components using shape optimization, you can enhance the overall performance of a tweeter. Using the Tweeter Dome and Waveguide Shape Optimization tutorial model, available with COMSOL Multiphysics, you can learn how to perform a shape optimization of a tweeter’s dome and waveguide to optimize its spatial and frequency-domain response. This requires optimizing over a range of frequencies as well as in space. The tutorial shows the steps to set up this problem.
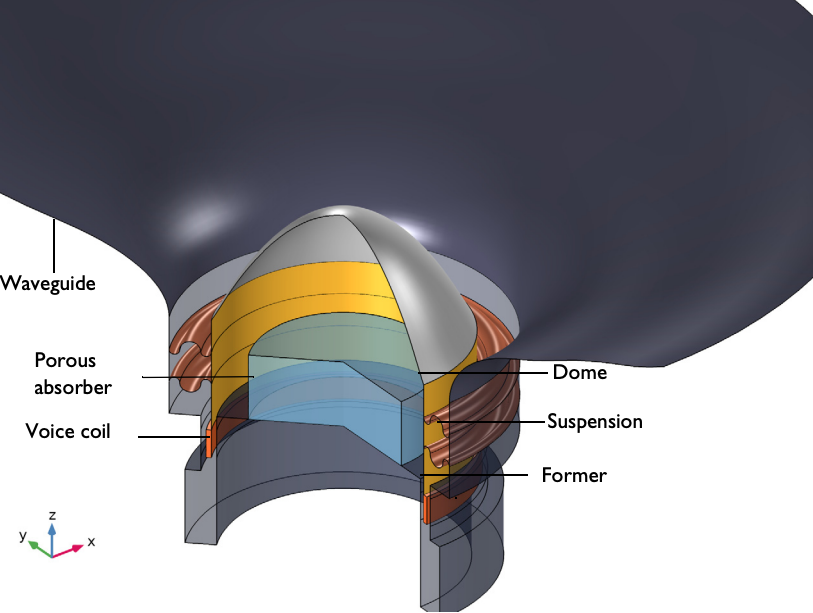
The main components of a tweeter.
The main components of this model include the:
- Waveguide
- Dome
- Porous absorber
- Voice coil
- Suspension
- Former
The suspension, dome, and voice coil are all modeled with the Solid Mechanics and Shell interfaces. A Thiele–Small analogous circuit is used to include the driver’s electromagnetic characteristics. Tweeters often have a foam insert to avoid exciting different dynamic effects in the design (such as resonances and dome flexible modes), therefore one such foam insert is added to the model. In addition, structural damping is also added to the model.
Results
In this model, the performance of the optimized tweeter design is analyzed by comparing it to the performance of the initial tweeter shape. Below, you can view the on-axis sound pressure levels (SPL) at 1 m for both tweeters. The flat target SPL is represented by a black, dotted horizontal line. Note that the optimized tweeter produces a nearly flat response in the desired frequency range from 5 kHz to 20 kHz. Also, note that two sets of curves are shown for each setup. They demonstrate two different approaches used to compute the far-field response in the model.
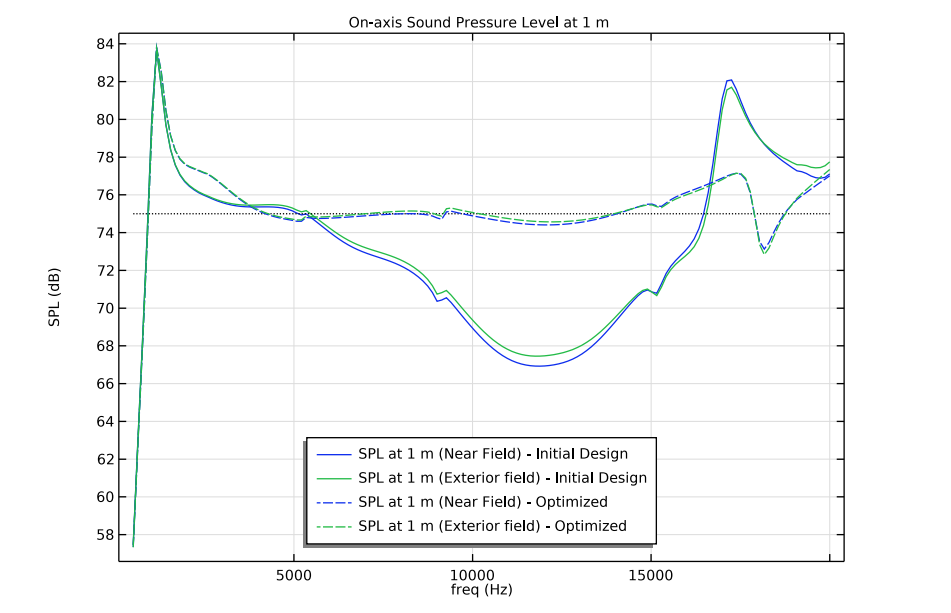
On-axis SPL at 1 m.
Next, you can compare the optimized and initial tweeter designs when operating at the maximum frequency of 20 kHz. By doing so, you can see the SPL distribution and the structural deformation of both tweeters’ domes, formers, and suspensions. The results, shown below, highlight that the initial design faces more deformation in its dome and former (this is also known as cone breakup) as compared to the optimized design.
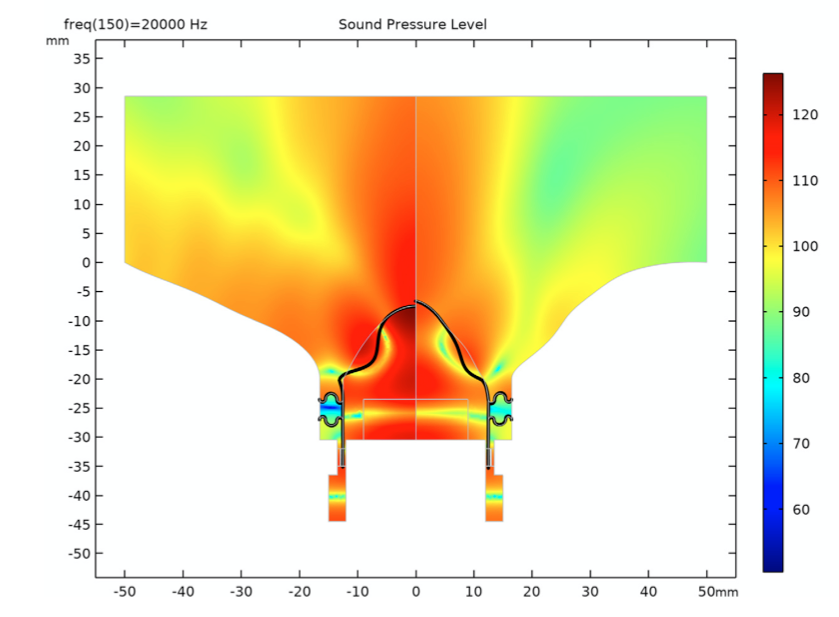
Here, you can see the deformation of both the initial tweeter design (left) and optimized tweeter design (right) when at an SPL generated at the highest frequency.
Finally, you can also study the directivity for both designs, shown below. The directivity plot highlights the frequency and spatial response in one plot. The region optimized for directivity is marked by the gray box. As seen from the plot, the response is flat in frequency while simultaneously having a uniform spatial coverage from about -10 to +10 deg.
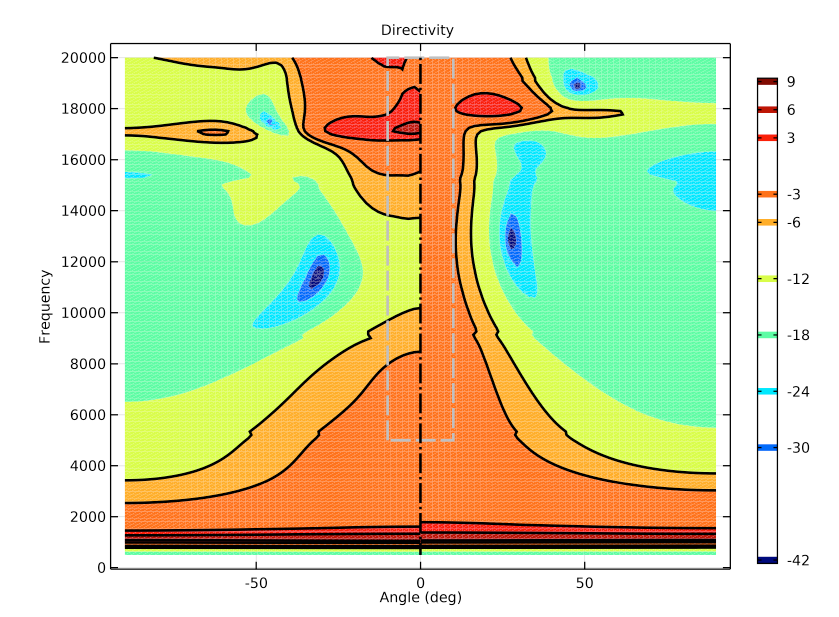
Directivity plot of the initial design (left) and optimized design (right). Here, the various colors represent the deviation from the target SPL. The black lines stand for the 3 dB and ±6 dB limits.
Overall, this tutorial highlights one method to optimize the performance of a tweeter design using shape optimization. Want to try it for yourself and ally it to your own design? Learn exactly how to build the Tweeter Dome and Waveguide Shape Optimization model by downloading the documentation and MPH file from the Application Gallery.
2. Optimizing a Loudspeaker’s Magnetic Circuit
Loudspeaker drivers include magnetic circuits, which concentrate the magnetic flux into the air gap. Inside the air gap, a coil is placed perpendicular to the magnetic flux lines and connected to the former and dome of the loudspeaker. When an alternating current travels through the coil, movement on the coil is induced via electromagnetic forces. As expected, the loudspeaker membrane picks up this movement, interacts with the surrounding air, and produces sound waves in the process.
A well-designed magnetic circuit is often made up of an iron pole piece and a top plate, which are able to:
- Maximize flux concentrated at the coil
- Provide a uniform field across the coil
The performance of a magnetic circuit is also often characterized by the BL parameter (the force factor). In a magnetic circuit, the BL is the product of the magnetic flux in the air gap and coil length. A high-performing magnetic circuit has a large BL parameter, but it is also desired that the BL parameter is constant for different voice coil positions, x. This is why the parameter is often denoted BL(x). A flat BL(x) curve will generally result in less distortion, as it results in linearity for that part of the speaker system. Here, the magnetic circuit is optimized using topology optimization.
Simulating a Magnetic Circuit
Using the Topology Optimization of a Magnetic Circuit tutorial model, you can perform two different topology optimization studies of a magnetic circuit’s components. The first optimization study is performed to generate a lightweight magnetic circuit design that has a strong magnetic field strength in the air gap as well as a maximum BL factor at rest position. The second optimization study is performed to produce a magnetic circuit with a flat BL(x) curve. The first design is ideal for loudspeakers operating at high frequencies (such as tweeters), while the second design is ideal for loudspeakers operating at low frequencies (like woofers).
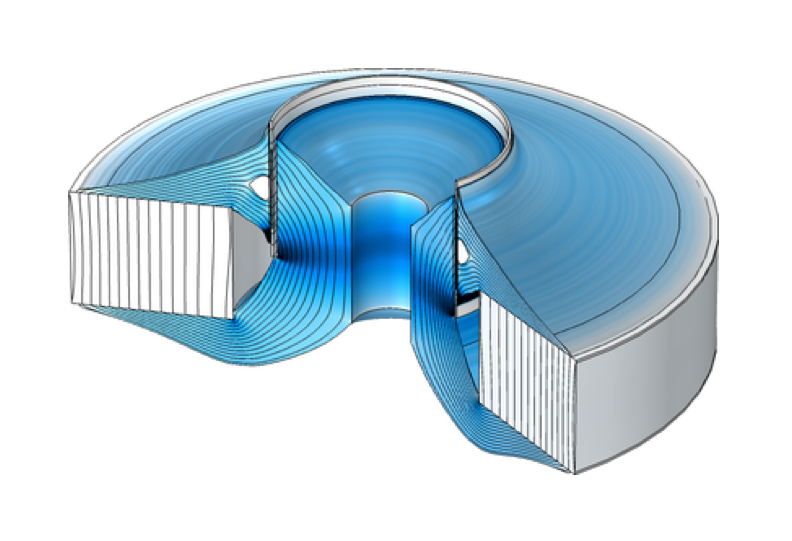
Optimized geometry of a loudspeaker with a magnetic circuit that results in a flat BL(x) curve (left). A close-up animation showing the steps toward the optimized shape of this magnetic circuit (right). Note that with topology optimization, the algorithm is free to add or remove iron and air in the gray area.
Both optimized designs are compared to the design of a traditional magnetic circuit, demonstrating improved performance in the process. The optimized designs also require a reduced amount of iron.
In addition, a validation model is created to validate the design generated in the second optimization study of the magnetic circuit.
Results
Below, you can view the magnetic flux density norm (top row) and the output material volume factor (bottom row) in both optimized designs. Note that the images in the left column represent the results of the magnetic circuit design from the first topology optimization study (high BL at rest design) and the images in the right column represent the results of the design from the second optimization study (flat BL(x) design).
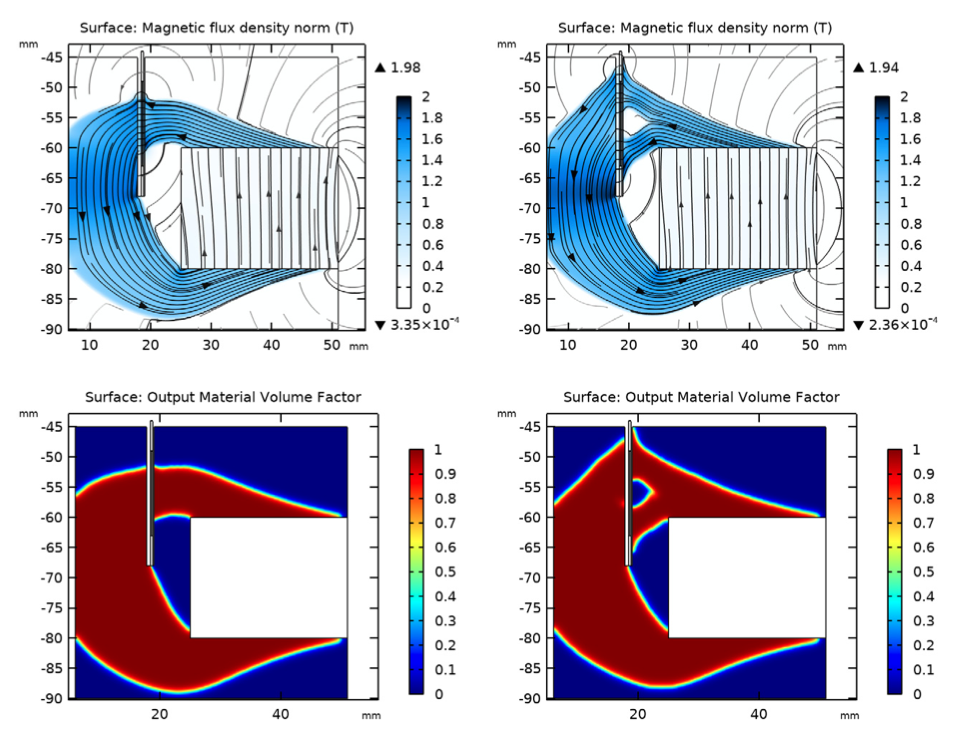
As expected, both results show that an optimized magnetic circuit consists of two separate parts:
- A central component connected to the bottom of the magnet (the pole piece or yoke)
- A separated part connected to the top of the magnet (the top plate)
In the line graph below, you can see the BL(x) curves for all of the different magnetic circuit models.
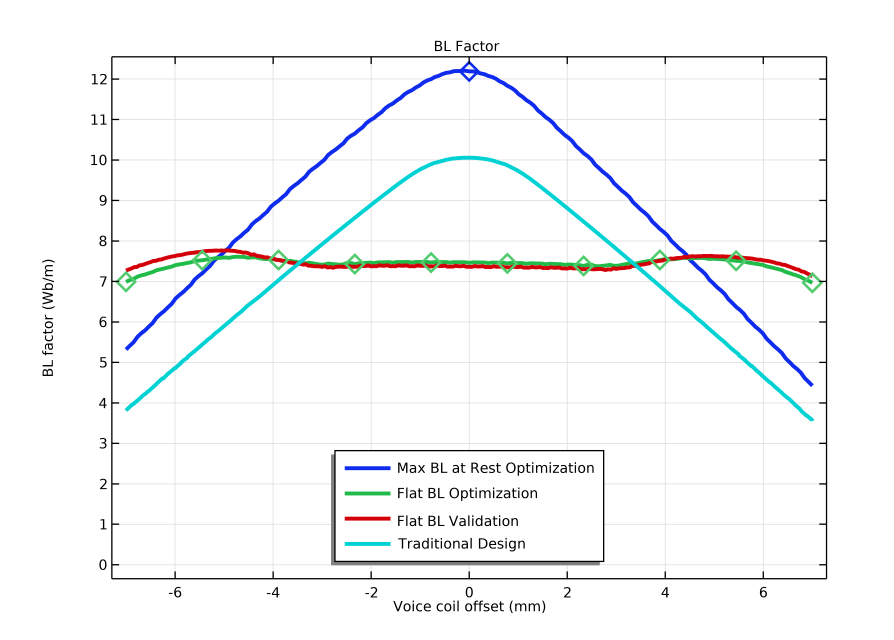
In this plot, you can see the BL(x) curves of a magnetic circuit with a maximum BL factor at rest position (dark blue), a magnetic circuit with a flat BL curve (green), a validation model (red), and a traditional magnetic circuit (light blue). Note: The results of the BL(x) curve from the traditional magnetic circuit design are based on the Loudspeaker Driver model.
Remember that the results shown here are part of a tutorial. Using COMSOL Multiphysics, design engineers can set up their own optimization problem, taking various design criteria into account; for example, the location of fixtures, special geometrical restrictions, or the overall weight of the system. The results from an optimization problem will, in general, inspire and generate innovative ideas that can then be further refined. Get step-by-step instructions on how to perform both of these topology optimization studies and check out the rest of the results here.
3. Enhancing a Loudspeaker’s Suspension System
In a loudspeaker, the suspension system is designed to secure the cone and dust cap and stabilize the voice coil. In most loudspeaker designs, the suspension system consists of the surround and spider. Below, you can view the suspension system as well as the other main components in a common loudspeaker design.
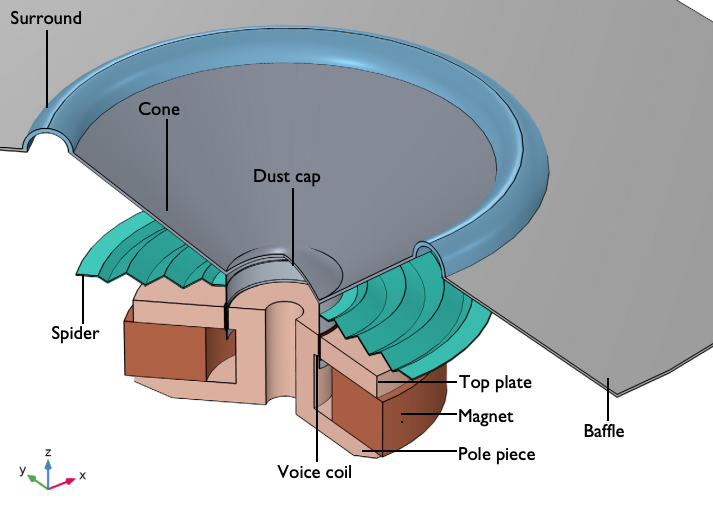
A typical loudspeaker design, featuring a suspension system.
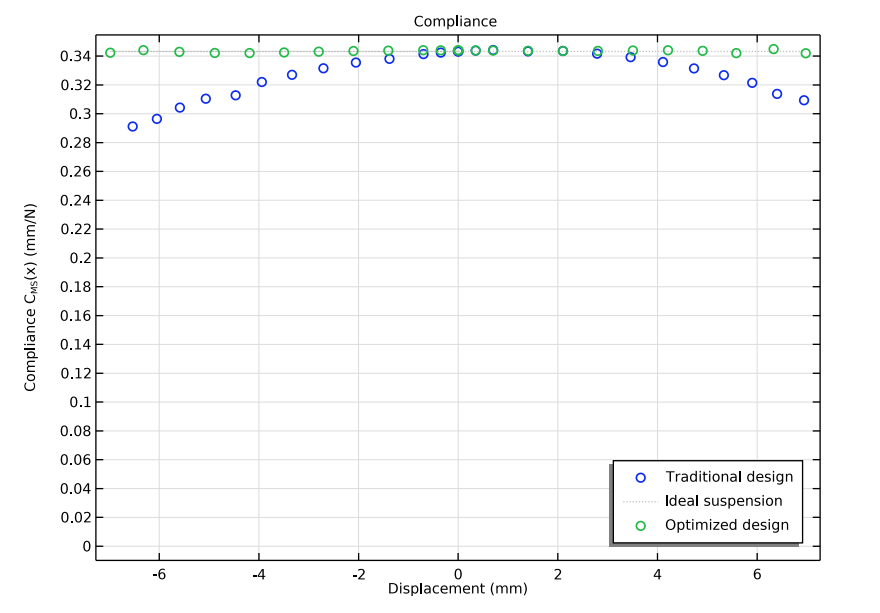
When operating at different frequency levels, a loudspeaker’s voice coil will move up and down. At high frequencies, the displacement is relatively small, but at low frequencies, the displacement is noticeable. When the displacement of the voice coil is significant, the compliance, CMS(x), varies along the path of the coil. The spring will stiffen for larger and larger deformations. This variation, or nonlinearity, can lead to distortion effects in a loudspeaker design. Above, the force factor, or BL(x), nonlinearity was treated in the topology optimization example.
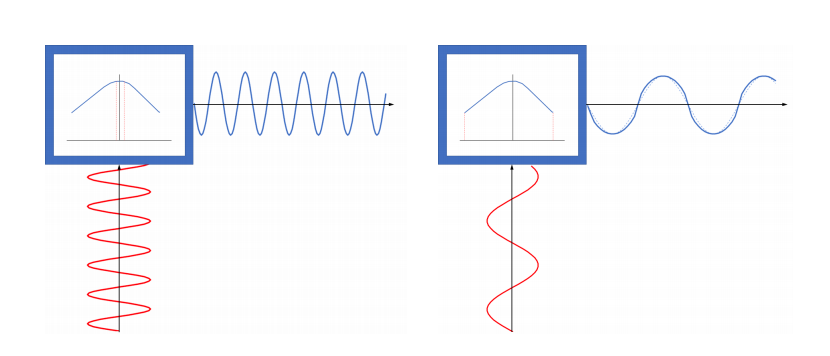
Here, you can see the displacement of a voice coil when excited by a high frequency (left) and low frequency (right). When excited at a high frequency, the displacement of the voice coil is small (operating in a flat region), but when excited at low frequencies, the displacement of the coil is significant. Note: In both images, the frequencies are represented by the red curved lines and the voice coils are represented by the blue curved lines.
It is possible to create a loudspeaker suspension system that behaves linearly, regardless of the voice coil’s range of movements. How? By changing the shape of the spider.
Designing an Optimized Spider
A spider in a loudspeaker’s suspension system is a thin, membrane-like mechanical part. They are often made from cloth and have a zigzag shape. As you may have guessed, it’s named after the 8-legged arachnid that it resembles.
Using the Loudspeaker Spider Optimization tutorial model, you can learn how to easily change the shape of a spider with shape optimization.
The model consists of two studies:
- Performance of a traditional spider (for comparison)
- Optimization and performance of a shape-optimized spider
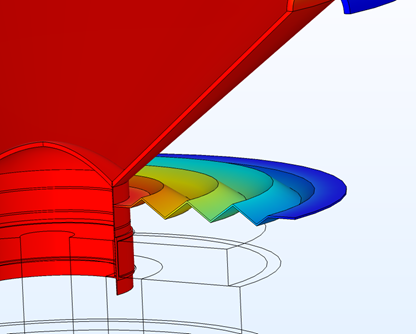
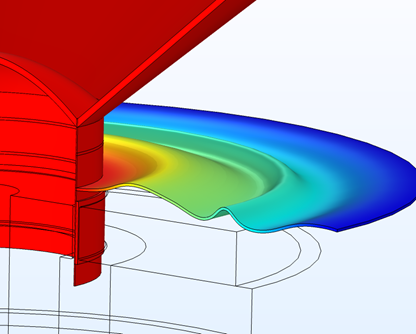
Traditional spider design (left) and the shape-optimized spider (right).
Results
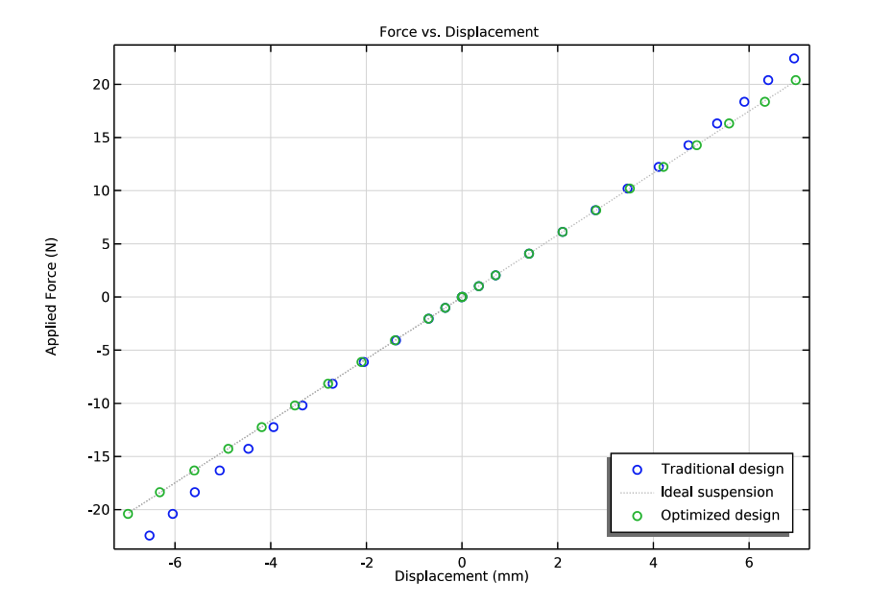
The model results show the force versus displacement (left) and compliance curves (right) of the traditional design (blue dots), the optimized design (green dots), and an idealized design (gray line). In both cases, the optimized design is a close match to the idealized design.
In this model, the objective is to get a flat compliance curve. However, it is often desired to have some degree of nonlinearity, such that the spring stiffens for large deformations, but instead ensure that the CMS(x) curve is symmetric. Development engineers are free to set this and other objectives when running their optimization models. Want to learn more about this model? Try the Loudspeaker Spider Optimization tutorial model here.
Next Steps
Learn more about the Optimization Module, which can be used to perform shape, topology, and parameter optimization studies of your designs, regardless of the physics or application area:
Further Reading
Read about other examples of modeling loudspeakers on the COMSOL Blog:




Comments (0)