
When simulating hearing aids, it’s important to determine how transducers interact with the rest of the system. In some cases, these studies require fully detailed models, increasing their computational cost. One alternative is coupling a lumped parameter transducer model with a multiphysics model representing the whole system. In this blog post, we discuss the example of a Knowles ED-23146 receiver (or miniature loudspeaker) that is connected to a test setup and compare the results to measurement data.
Multiphysics Simulation Helps to Improve Hearing Aid Designs
To develop better hearing aids, engineers continuously improve their designs to enhance sound quality, increase output, reduce feedback problems, and provide new features to help users. For instance, future versions of hearing aids may contain brain-computer interfaces to enable the hard of hearing to more easily listen to individual conversations or sounds while ignoring background noise.
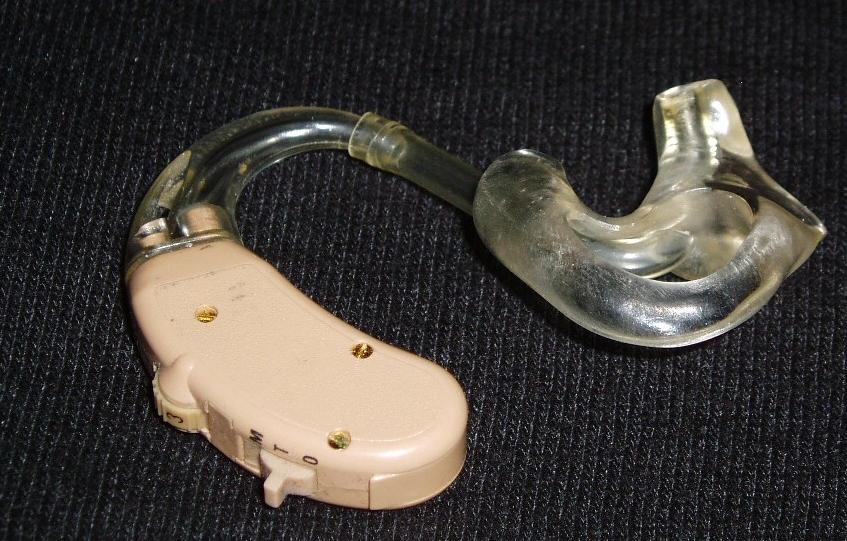
A behind-the-ear (BTE) hearing aid. Image by Udo Schröter — Own work. Licensed under CC BY-SA 3.0, via Wikimedia Commons.
By analyzing hearing aids with simulation, engineers can develop innovative devices. For this type of study, they need to analyze how the transducer interacts with the system as a whole. This can be computationally expensive because some studies, such as a vibration isolation analysis of the transducer’s elastic mounting, require fully detailed multiphysics models that include details on the transducer’s inner workings.
For other studies, such as evaluating the electroacoustic response of a hearing aid, engineers can instead use lumped-parameter modeling. In this case, they can create a lumped parameter model of the transducer (or use a model provided by the manufacturer) and couple it to a multiphysics model that represents the rest of the system. This lumped parameter transducer model serves as an electroacoustic analogy, similar to those used in SPICE.
Using Lumped-Parameter Modeling to Analyze Hearing Aid Receivers
Let’s discuss a multiphysics model of a Knowles ED-23146 balanced armature receiver (also known as a miniature loudspeaker), which is based on data provided by Knowles, IL, USA. This model requires both the Acoustics Module and AC/DC Module — add-on products to the COMSOL Multiphysics® software.
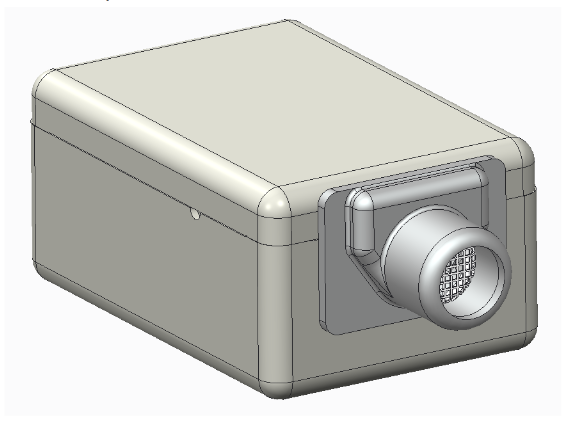
A Knowles ED-23146 balanced armature receiver. Image courtesy of Knowles, IL, USA.
We model the receiver, seen on the left-hand side of the image below, as a lumped SPICE network. This lumped receiver model is connected to a test setup that includes a 50-mm earmold tube as well as a generic simplified 0.4-cc measurement coupler (this is a standardized ear canal simulator). We use the test setup to represent the receiver in a BTE hearing aid.

The modeled system includes a receiver, tube, coupler, and measurement microphone. Everything in blue is modeled with finite elements.
To account for the viscous and thermal losses occurring in the narrow tube, we use the Narrow Region Acoustics feature in the Pressure Acoustics, Frequency Domain interface. We don’t include the losses caused by the impedance jump from the tube to the coupler.
Note that while narrow region acoustics models have a lower computational cost, it’s better to use full thermoviscous acoustics models when working with complicated geometries. The narrow region acoustics models are valid for waveguides with constant cross sections. More information can be found in the Acoustics Module User’s Guide.
Comparing the Simulation Results with Known Measurements
By comparing the simulation results with existing measurements, we can see that our model generates good predictions across a broad frequency band.
For example, let’s look at the response at the microphone’s location in the coupler. The image below compares the results from the full model with known measurements and those from a model without viscous and thermal acoustic losses. The full model agrees well with the known measurements, but the results don’t match at frequencies above 14 kHz. This is because the wavelength becomes comparable to the length scales of structures missing from the simplified model, such as the microphone’s protective mesh. Further, at these high frequencies, the lumped parameter model is imprecise. It is also evident that including the thermoviscous losses is important to get correct results.
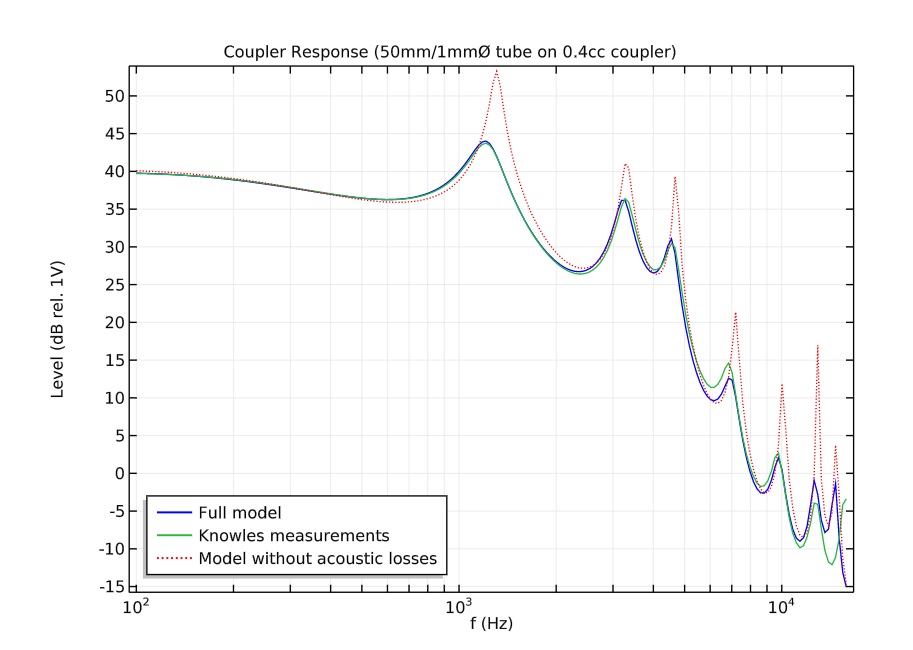
A comparison of the microphone response for a model that includes thermal and viscous losses, a model without these losses, and existing measurements. Measurement data is provided by Knowles, IL, USA.
Next, let’s examine the frequency dependency of the transducer’s electric input impedance (real and imaginary). The results indicate that values from the simulation and measurements are in good agreement.
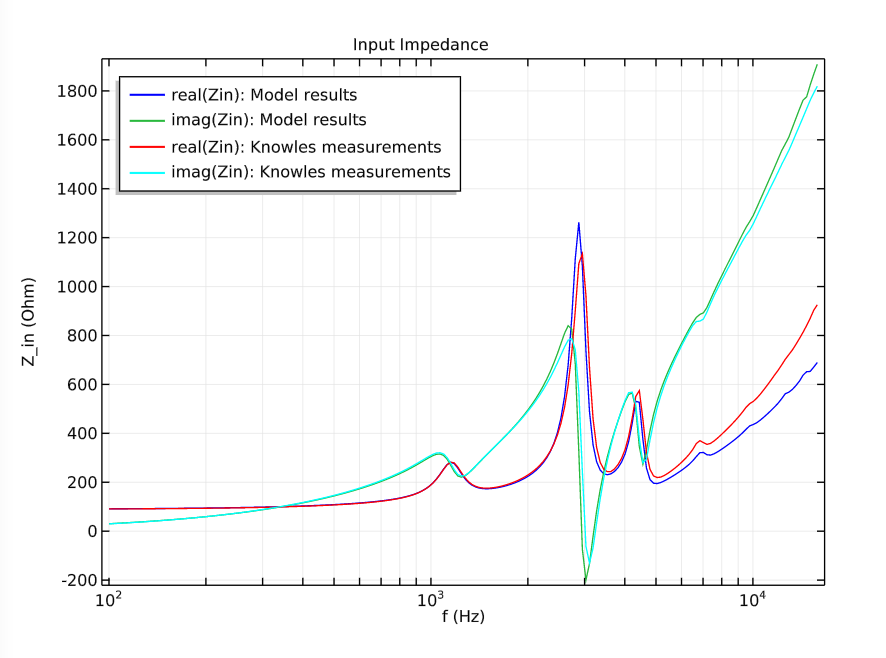
The electric input impedance (both real and imaginary) as a function of the frequency. The model results are compared to existing measurements. Measurement data is provided by Knowles, IL, USA.
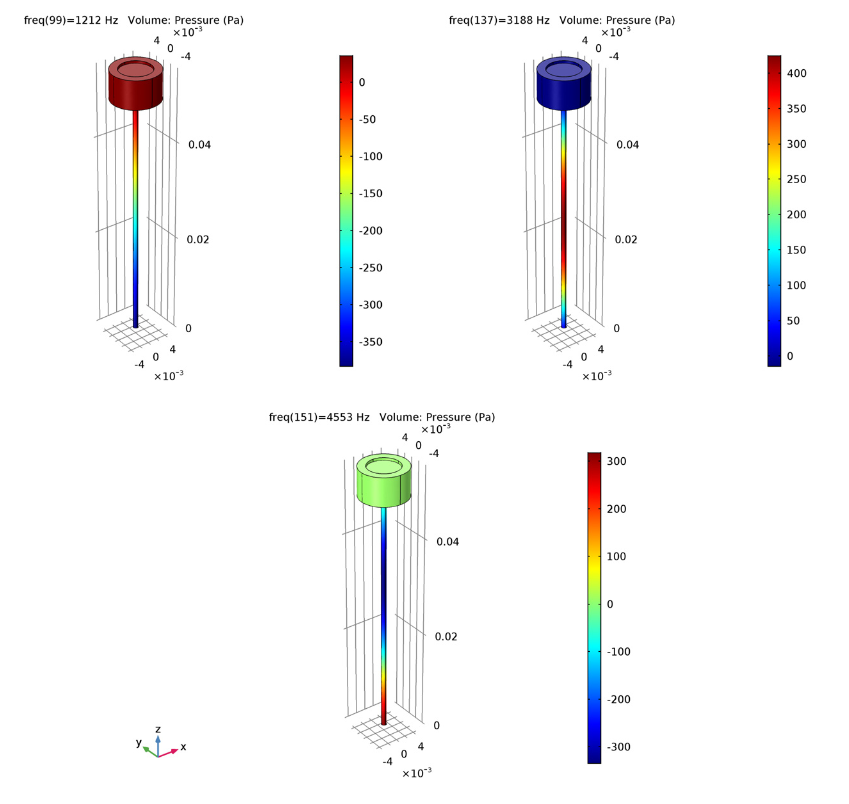
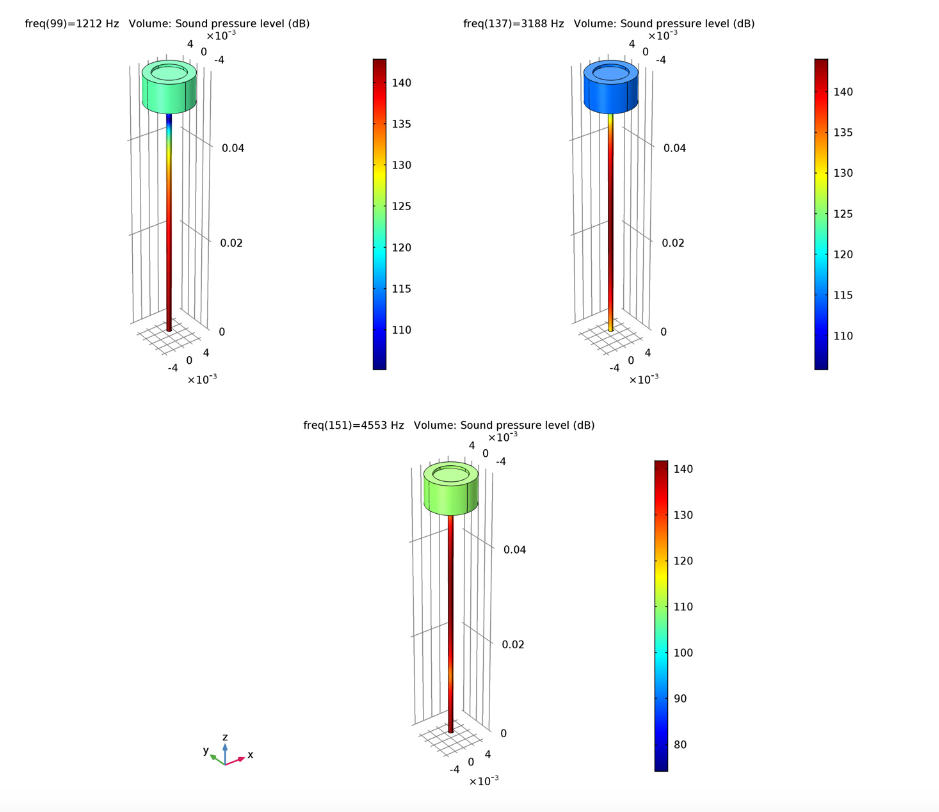
We can also analyze the pressure and sound pressure level distribution within the tube and coupler system for three frequencies (1200, 3200, and 4600 Hz). The model’s evaluated frequencies correspond to the response’s first three peaks. Specifically, they relate to the tube and coupler system’s quarter-, half-, and three-quarter-wave resonances, respectively.
The pressure distribution (left) and sound pressure level distribution (right) at three different frequencies.




Comments (0)