All posts by Lexi Carver
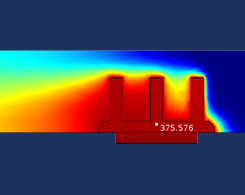
Using Annotation Plots in Your 2D and 3D Plot Groups
You can label the plots of your simulation results with names, comments, and values of quantities evaluated at specified locations. How? By adding annotation plots!
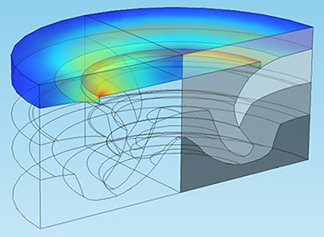
Using Simulation in the Race Against Corrosion
A German research institute and a well-known car manufacturer joined forces to investigate the corrosion occurring in automotive rivets and sheet metal. Get the full story.
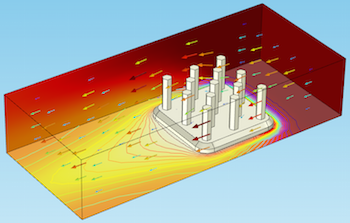
Useful Tools for Postprocessing in COMSOL Multiphysics
Layering plots; style inheritance; enabling and disabling grids, axes, and legends; showing mesh plots, and more: We go over some useful tools for postprocessing your simulation results.
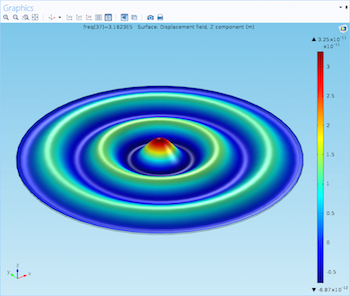
Using Deformations to Visualize Physical Motion
Postprocessing and visualization can help enhance your understanding of simulation results, and using plots to illustrate physical motion allows you to put everything into perspective.
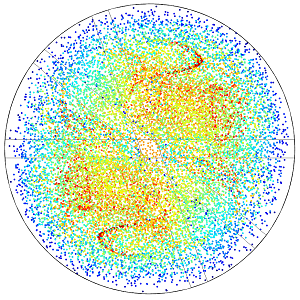
Application-Specific: Polar, Far-Field, and Particle Tracing Plots
When postprocessing your electromagnetics models, you can use polar, far-field, and particle tracing plots to effectively display your results. Learn how to use these 3 plot types here.
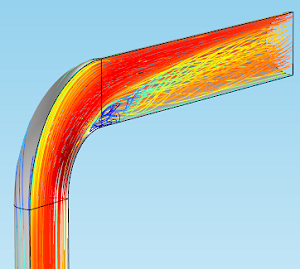
Visualizing Fluid Flow with Streamline Plots
As part of our blog series on postprocessing, we demonstrate the use of streamlines to visually describe fluid flow in your simulations. Learn how with an example of flow through a pipe elbow.
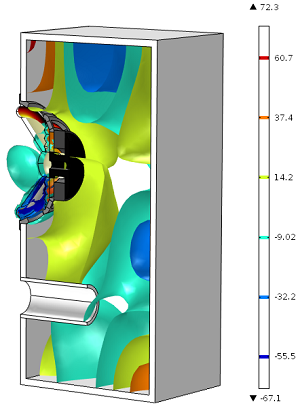
Making Waves with Contour and Isosurface Plots
In this installment of our blog series on postprocessing your simulation results, learn how to use contour and isosurface plots to show quantities on a series of lines or surfaces.
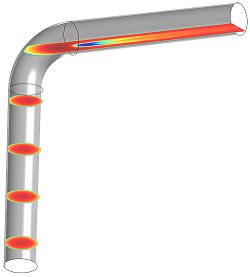
Using Slice Plots to Show Results on Cross-Sectional Surfaces
In this installment of our blog series on postprocessing your simulation results, we demonstrate slice plots, an easy way to visualize physics behavior on many different parts of your model.
