Results & Visualization Blog Posts
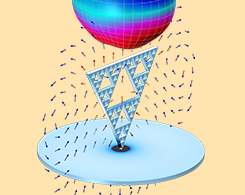
What Is the Curl Element (and Why Is It Used)?
When solving some electromagnetics problems, the curl element (also called the edge element or vector element) can be used in the finite element method.
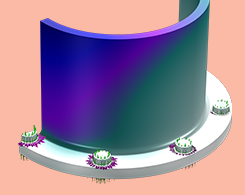
How to Use the Load Plots in Structural Analyses
You can use the load plots available in the COMSOL® software to get the best possible visualization of the loads acting on your structural mechanics models in various situations.
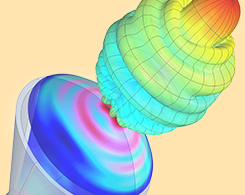
How to Produce 3D Far-Field Plots from 2D Axisymmetric RF Models
When modeling certain resonant structures, you can get the best of both worlds: 2D axisymmetry offers efficient computations while 3D far-field plots are available for postprocessing results.

Introduction to Numerical Integration and Gauss Points
In this comprehensive blog post, we go over the theory behind numerical integration, Gaussian quadrature, Gauss points, weak contributions, and much more.
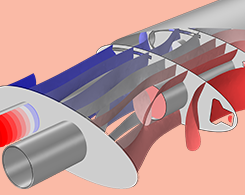
Using the Port Boundary Condition in Acoustic Waveguide Models
By combining several Port boundary conditions, you can easily compute the transmission and insertion loss in exhaust and muffler systems. See more benefits of this feature for acoustics modeling.

How to Create Custom Reports Using Report Templates
You can document and showcase your simulation setups and results with reports. To make this process more efficient, COMSOL Multiphysics® includes tools for creating easy-to-use report templates.
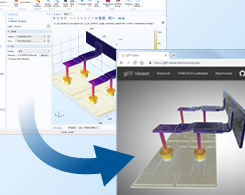
How to Export (and Share) Your 3D Result Plots as glTF™ Files
Wow your project stakeholders by sharing your 3D COMSOL Multiphysics® results as glTF™ files. We show you how to export plots and share them in third-party graphics viewers.

How to Create Animations Along the Azimuthal Direction for 3D Models
Here’s a useful postprocessing trick for presenting your 3D modeling results: combine slice plots along the azimuthal direction in order to generate a nontrivial animation.
