
Nondestructive testing (NDT) has widespread use in academia and industry for means of quality control, product inspection, lifetime assessment, and more. Ensuring the safety of technical systems during operation is key to avoiding incidents with potential loss of life. Almost all NDT instrument readings are influenced by external factors; e.g., temperature-induced material changes. Other methods explicitly use coupled measurement principles, such as friction-induced temperature generation or piezoelectric sensing systems. There are many reasons to model NDT techniques with a dedicated multiphysics platform, powerful enough for quantitative description of nearly all NDT methods applied today.
NDT Measurement
Most of the time, an NDT approach aims to “interrogate” the material or structure of interest and tries to retrieve some information from the signals provided by the testing instrument. In some methods, this is straightforward, since the relationships between incident waves and any sort of discontinuities are easy to understand. However, that is not the case for most of the NDT methods.
For active ultrasonic testing, we send an ultrasonic wave into the material and try to understand the internal structure from the reflected wave. In many practical situations, the wave interaction with the internal structure is not intuitive to the human inspector.
Modeling has proven its worthiness to shed some light on the details of such wave propagation and interaction.
Active Thermography
In active thermography, we heat materials or structures by an external source (e.g., a lamp) or internal source (e.g., friction) to cause a sudden temperature change. In case there are any discontinuities, heat redistribution is affected differently to the rest of the material. We monitor this temperature change by IR cameras as a function of time as a measurement. These temperature images, and phase images in cases of cyclic heating, form the backbone for the interpretation. However, in practical situations, indications might be shaded, flares might occur due to the camera angle, and additional heat sources or heat leaks could mess up the measurement.
Modeling, in turn, helps a lot to identify meaningful experimental conditions, such as test frequency or the duration and number of heat cycles before even starting the measurement. One can artificially place discontinuities (any sort of anomalies, like defects, material changes, and voids) and assess their interaction with the externally induced temperature changes. This allows evaluating the resulting temperature fields and assessing the expected visibility for that sort of discontinuity in a real inspection condition.
Below is a comparison of phase images from experimental measurements using lock-in thermography and modeling for a fiber-reinforced laminate with several internal defects. To test the effectiveness of an inspection parameter, such as frequency, for detection of inserts, cut-outs, drill holes, and more, such reference bodies provide a good first assessment.
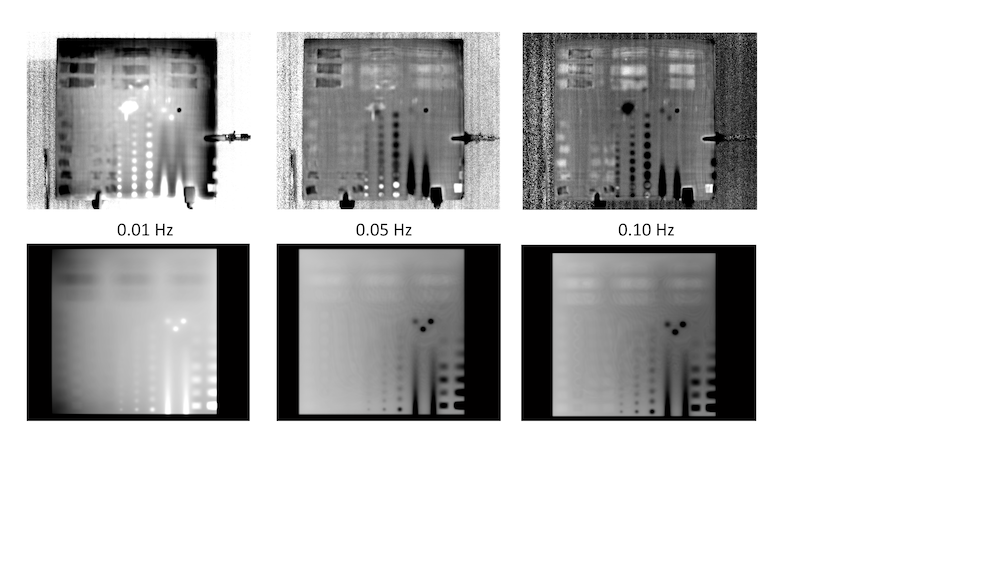
Top: Phase images from experimental measurements using lock-in thermography for a fiber-reinforced laminate with several internal defects. Bottom: Corresponding modeling for three test frequencies.
Active Ultrasonic
In active ultrasonic, we inspect materials and structures by sending an acoustic pulse in the ultrasonic frequency range into the material and then detect its echo. The interpretation of such ultrasonic waves is something that is mostly accessible to well-experienced test personnel. Due to the complexity of acoustic wave propagation in real testing scenarios and their interaction with any sorts of internal discontinuities, much of the conclusions rely on comparative measurements or very conservative standards.
With the power of modeling, one can start to visualize the spreading of the ultrasonic wave on the interior of the structure and “see” its interaction with any sorts of discontinuities. This significantly improves the interpretation of the experimental signals. With multiphysics modeling of the transducers, it is also possible to optimize their design and select an appropriate choice for a given inspection condition. This is particularly helpful to find suitable test frequencies and incidence angles, but also helps to understand how conversion of the ultrasonic wave into an electrical signal happens in general.
As seen in the image below, with dedicated multiphysics modeling, a 2D-axisymmetric transducer model is combined with a 3D model of a region of interest inside a test structure. The resulting electrical voltage signals may be compared directly with an experimental signal and allows assessing the detectability of the modeled internal defects.
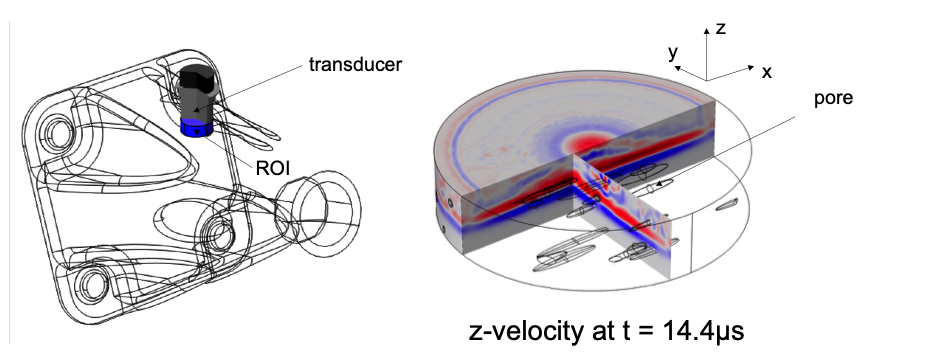
Left: Schematic of inspection geometry (outlined in black), including volume directly below the transducer model as a region of interest (ROI). Right: Visualization of internal interaction of the acoustic wave field incident to some pores in the ROI.
Guided Waves
Another type of testing method that uses ultrasonic waves is called guided wave testing. In thin-walled structures, such guided waves form due to the geometrical restriction of the propagation medium in one axis (e.g., the thickness direction). In flat structures, these guided waves are called plate waves, while in tubes, these are called cylinder waves.
For the inspection of pipelines, these waves are quite advantageous, since they allow inspecting large portions of the pipeline at one shot. However, the interaction with internal discontinuities is even more challenging for classical active ultrasonic testing. The reason is the formation of multiple distinct wave modes, which in turn independently interact with internal discontinuities and potentially even split into more modes upon reflection. In modeling, the visualization of their propagation behavior helps tremendously to understand the type of wave motion in a given inspection condition. The multiphysics modeling additionally allows efficient checking of factors of influence, such as temperature-induced changes of the propagation medium.
The example provides a comparison of the two different wave modes excited at the center of the plate briefly after interaction with a hole in the plate and a pin welded to the plate. Despite being the same diameter, the resulting wave field is different. Whilst the low-frequency guided wave mode is not affected by the obstacle, the high-frequency wave mode provides serious interaction and thus detection capability.
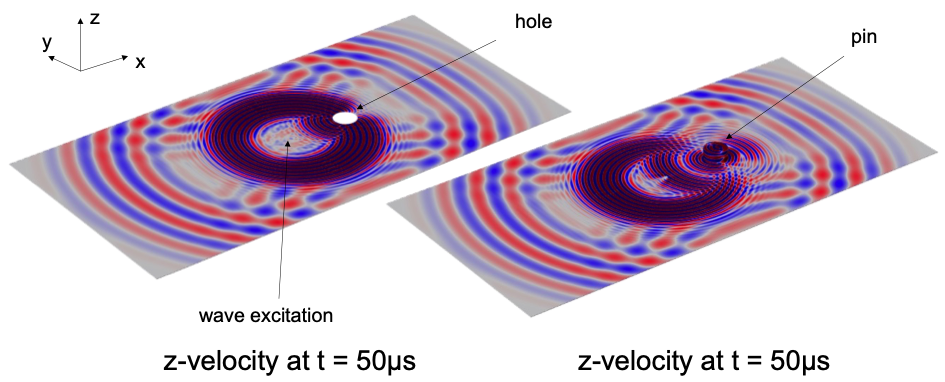
Left: Snapshot of the wave field after scattering at the hole inside the plate. Right: Snapshot of the wave field after interaction with the welded pin.
Acoustic Emission
The acoustic emission method uses piezoelectric sensing systems directly attached to a material or structure. Similar to earthquakes on a much larger scale, the occurrence of a microscopic crack in a material causes an elastic wave, which is emitted in the ultrasonic range. The occurrence of this acoustic emission is indicative of the damage status of a material, and its sources can be triangulated using a sensor array. However, the interpretation of the recorded signals is quite challenging. Much of the interpretation is carried out based on the experience of the operators or estimates found in standards and guidelines.
A completely new perspective on acoustic emission is achieved by modeling the full process. This requires the mechanical modeling of the dynamic crack propagation, its conversion into an ultrasonic wave, and its wave propagation. Finally, the detection process using piezoelectric sensors needs to be adequately captured, since it has a strong influence on the signal information. To cover these demands, a multiscale and multiphysics model is required.
With the ability to link structural mechanics with transient wave modeling and piezoelectric conversion, such can be readily achieved, as seen below. Starting with a fracture-mechanics-based modeling of a particular defect type, the resulting elastic wave propagation can readily be derived. With dedicated piezoelectric sensor modeling, this allows conversion into an electrical signal and direct comparison with experimental signals.
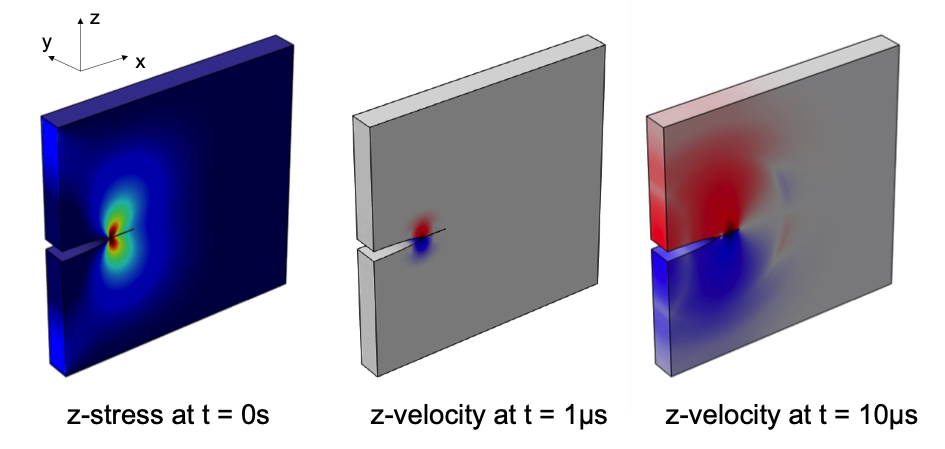
Left: Stationary modeling of a stress field localized at a notch tip. Center: Dynamic crack propagation using cohesive zone modeling. Right: Propagation of a wave field after a crack has come to rest.
Eddy Currents
For inspection of conductive materials, eddy current testing is frequently applied. This measurement is based on the excitation of eddy currents inside the test material using the (primary) magnetic field of an AC-driven coil inside a transducer. The much smaller (secondary) magnetic field generated by the eddy current is recorded with the pick-up coil of the transducer. In case of any discontinuities inside the material (e.g., cracks), the formation of eddy currents is affected and its feedback into the pick-up coil is detected. Hence, all signal interpretation is based on the electrical impedance change of the pick-up coil. Very similar to the acoustic methods, the interpretation of these changes in electrical impedance requires thorough skills and experience. Despite its rigid physical principles, the mechanisms of interaction are quite difficult to teach and understand.
Modeling of the probe interaction with its surroundings helps capture the key principles of eddy current testing. Moreover, new probe designs and their sensitivity to detect defects in given scenarios can be assessed. Using state-of-the-art electrical and magnetic field modeling, coupled with P-Spice circuit modeling, this is a straightforward approach.
Below is a view of the primary magnetic field lines that form around an eddy current probehead. The presence of the flaw (e.g., crack) causes a noticeable change in the eddy current flow pattern and affects the magnetic field. The reaction of the probe to the presence of the flaw is evaluated from the coupling of the eddy-current-induced magnetic field to the impedance of the detection coil.
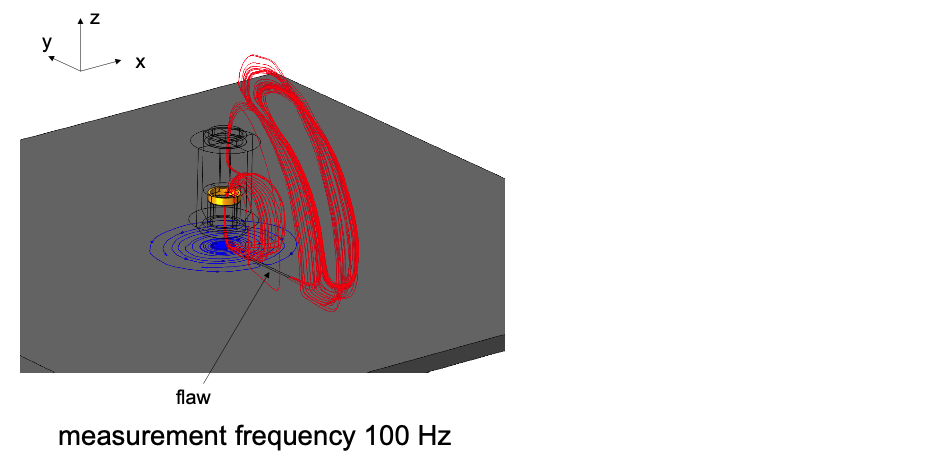
Modeling of the eddy current flow pattern (blue) close to a flaw and the interaction with the magnetic field lines (red) to detect the impedance change of coil (orange) inside the probehead.
Other NDT Methods
In addition to the examples presented above, many other commonly applied NDT methods can benefit from multiphysics modeling. For liquid penetrant testing, capillary action can be modeled. Formation of indications in magnetic particle testing is calculated from the modeling of leakage fields close to discontinuities. The level of temperature-induced deformation in shearography can be obtained in thermomechanical approaches. The interaction of microwaves or terahertz waves with the internal structure can be calculated, and the design of the probes optimized.
Finally, with its unique and easy ability to combine different types of physics, the COMSOL Multiphysics® software also contributes to the development of future NDT techniques. These tend to be multiphysics concepts more and more, and benefit tremendously from dedicated modeling alongside with their experimental development. The question is not whether or not a NDT method can be modeled, but if the required level of detail exceeds the available computational resources.
About the Author
Dr. habil. Markus Sause studied physics at the University of Augsburg and earned his doctoral degree in 2010 in experimental physics at the same place. He received the “Erich-Krautz-Preis” in 2010 for his outstanding contribution to the interpretation of acoustic emission of fiber-reinforced materials. In 2015, he succeeded with his habilitation in experimental physics. Since 2016, he has been a professor at University of Augsburg at the Institute for Materials Resource Management. In 2019, he received the “Science Award” from the German NDT society (DGZfP) for his outstanding contributions to the field of nondestructive testing. Since 2014, he has been a member of the EWGAE executive committee and active in several other committees dedicated to the testing and analysis of fiber-reinforced materials. His research interests span the mechanics of fiber-reinforced composites, their destructive and nondestructive testing, as well as numerical methods to interpret the material behavior, resulting in >100 publications. A special focus is given to bridge the gap between destructive testing approaches and nondestructive inspection to perform in situ analysis of material failure.




Comments (9)
Durgesh Tamhane
December 18, 2019Is there a COMSOL .mph file for the eddy current probe available?
Tom Aubier
February 2, 2021Hi, I would be interesting in studying the active ultrasound model presented above, is the file publicly available?
Best regards.
Markus Sause
February 2, 2021Unfortunately, the model is not publically available. Please drop me an email, so we can find a good way for an exchange.
– Markus
Harikrishnan Nampoothiri
February 22, 2022Can you please send the model of eddy current in comsol
Email-harikrishnanvn97@pg.cusat.ac.in
Harikrishnan Nampoothiri
March 6, 2022sir please support us kindly can you share the files
Luke Megonigal
February 3, 2021Hello. Is there a way to see the Guided Waves model?
Sergio Andres Motta Mejia
January 19, 2023Hello, I am mechatronics’s student. Please, Could you send me the COMSOL.mph file of Eddy Current?
I am studying for my degree protect, it would be a great helpful.
My gmail is smotta507@unab.edu.co
Mohammad Hassannezhad
June 27, 2023how can I propagate the Guided Waves in the 3d model? Is there any mph file available for that?
Mark de Vries
September 25, 2023Hi Markus,
I would be interested in studying the model of the lock-in Thermography presented in your blog. Is this publicly available or would you need my email for an exchange?
-Mark