
In the design of many structures, a particular area of concern is exposure to seismic and wind-induced vibrations. Viscoelastic structural dampers have been implemented into structural layouts as a means to limit the strain and decrease the risk of failure in building components due to such excitations.
The Impact of Vibrations on Structures
When a structure undergoes vibrations, its components experience stresses and strains, which are amplified by the excitation of the natural frequencies of the structure. In addition to potential damage to the structure itself, these oscillations can also be a source of discomfort and disruption for occupants.
Whether a rare or persistent hurdle, seismic and wind-induced vibrations, and their effects, are an important consideration in the design process. Damping is one influence that has proved valuable in helping to reduce such vibrations, particularly in tall buildings and bridges, and preserve the longevity of these structures.
Modeling Viscoelastic Structural Dampers
Did you know that you can model viscoelastic structural dampers using COMSOL Multiphysics? To get you started, we have created a tutorial model. The Viscoelastic Structural Damper model can be found in the Model Gallery as well as within the Structural Mechanics Module Model Library.
Frequency Response Analysis
The model first analyzes the frequency response of a viscoelastic structural damper. Comprised of two layers of viscoelastic material, the damper is restrained between steel mounting elements.
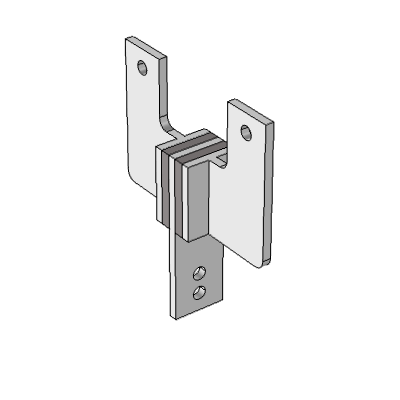
Image depicts the two layers of viscoelastic material in bold, with the steel mounting elements shown in light gray.
Here, two of the mounting elements are subjected to periodic forces, with frequencies ranging from 0 to 5 Hz. Meanwhile, one of the mounting elements remains fixed. The figure below shows the displacement of the damper at 5 Hz. The second figure highlights the relationship between the applied frequency and the storage modulus and loss moduli, a representation of the viscoelastic properties of the material.
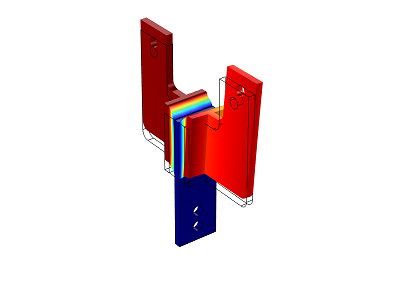
Displacement at 5 Hz.
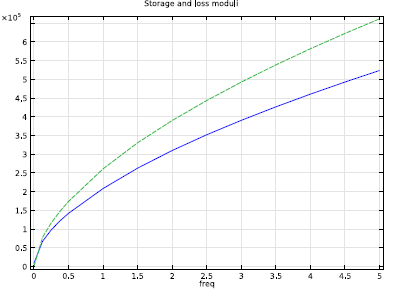
Plot of storage (blue line) and loss moduli (green line).
Transient Analysis
Next, we can run a transient analysis to find out the displacement field as a function of time, as seen in the figure below.
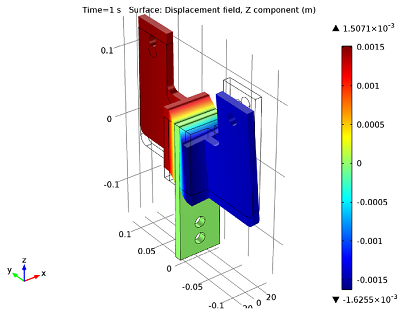
Surface plot of the z-component of displacement field after 1 second of forced vibrations.
Plotting the applied force versus the displacement at one of the loaded points shows hysteresis loops, which are characteristic for damped problems. Energy is dissipated since the force and displacement are out of phase with each other.
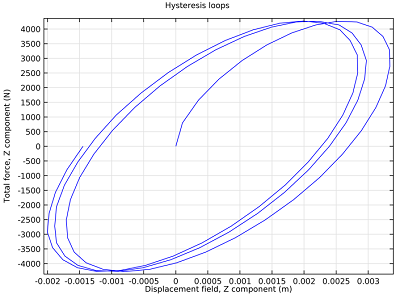
2D plot relating the displacement to the applied force.


Comments (0)