
Today, guest blogger Vera Erends joins us to discuss using simulation to understand the operation of an ultrahigh vacuum system with astronomical applications…
The proposed Einstein Telescope (ET) will be a third-generation observatory of gravitational waves. It will build on the success of existing laser interferometric detectors. Over the past 5 years, there have been breakthrough discoveries of merging black holes (BHs) and neutron stars. These discoveries have brought scientists into a new era of gravitational wave astronomy. The ET is to be constructed in underground tunnels, arranged in a triangular shape with arms of 10 kilometers.
Around 2024, a decision will be made on where to build the Einstein Telescope. Both the border region near Maastricht, the Netherlands, and an area in Sardinia have been proposed for a possible location.
In anticipation of the ET, a Belgian-German-Dutch consortium has already started to build a research facility on a smaller scale near Maastricht called the ETpathfinder. It will house a gravity wave detector with path lengths of twenty meters long. The measurement devices will be similar to those in the ET.
The facility is intended to become an international center for research in:
- Gravitational astronomy
- High-precision measurement techniques
- Seismic isolation
- Measurement and control software
- Cryogenics
- Quantum optics
The design of the ETpathfinder was done by the Dutch National Institute for Subatomic Physics (Nikhef) in Amsterdam in cooperation with the Maastricht University. Several principles will be tested and developed so that third-generation gravitational wave detectors, such as the interferometers with cryogenic mirrors for the Einstein Telescope, can be realized.
What Is the ETpathfinder?
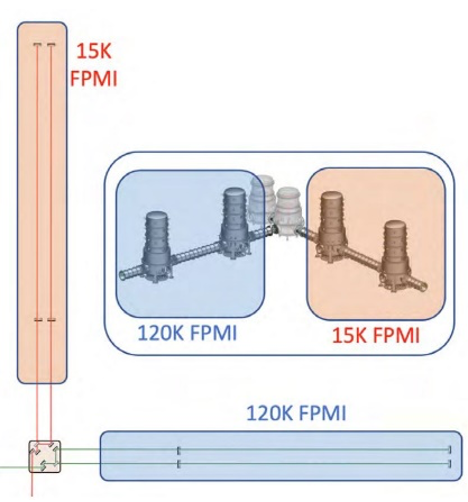
The figure below shows the schematic representation of the ETpathfinder. It consists of two trajectories, 20 meters in length, containing vacuum tubes that operate as vibrating cavities. Light will bounce between two mirrors. These mirrors are situated in so-called towers, operate at vacuum, and are set at a distance of 10 meters with respect to each other.
In a typical gravitational wave detector, the two vibrating cavities in the trajectories are at a ninety-degree angle with respect to each other, like in the Fabry-Perot-Michelson interferometer (FPMI). In the first phase of the ETpathfinder’s investigation, trajectories contain an FPMI. Then, using small optical components, not one but two vibrating cavities are placed in each arm. In this way, the two trajectories can be used for research at two different laser wavelengths and operating temperatures (15 K and 120 K).
Ultrahigh Vacuum Systems in the Mirror Towers
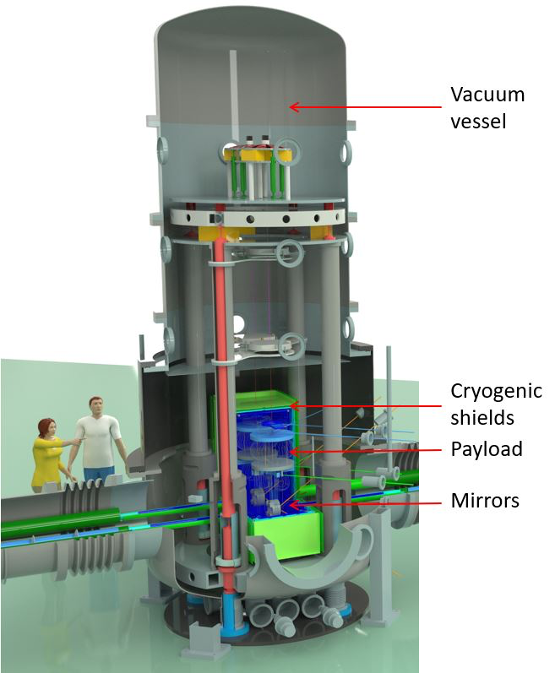
The cryogenic and vacuum technologies are the prime focus of this research into the ETpathfinder using simulations, specifically the optical mirrors and cryogenic shields in the mirror towers, as shown in the figure below. At the ultrahigh operating vacuum of 10-9 mbar, 99% of all particles present are water molecules. These water molecules have a tendency to bind to surfaces and form layers (mono- and multilayers). If such a layer is formed on the surface of the mirrors, which are cooled to 10 K, the water molecules will freeze and, as a result, the laser beam will be refracted. The photons will be absorbed by the mirror instead of being reflected, causing the mirror to locally heat up and thermally deform, thus adversely influencing the quality of the interferometer.
The mirror towers need to be opened several times per year for maintenance and research. When resuming operation, the gases need to be expelled. To speed this up, the temperature will be raised. Because of all of the electronics and sensitive materials that expand at high temperatures, the tower may not be submitted to temperatures above 338 K.
Cooling Strategy
It is unavoidable that once vacuum has been reached, some water molecules will still remain in the vacuum chamber. If the cryogenic shields and mirrors cool simultaneously, there is a high probability that these molecules will bind to the mirror surface and remain there for a long time (centuries). To prevent this from happening, a cooling strategy has been devised.
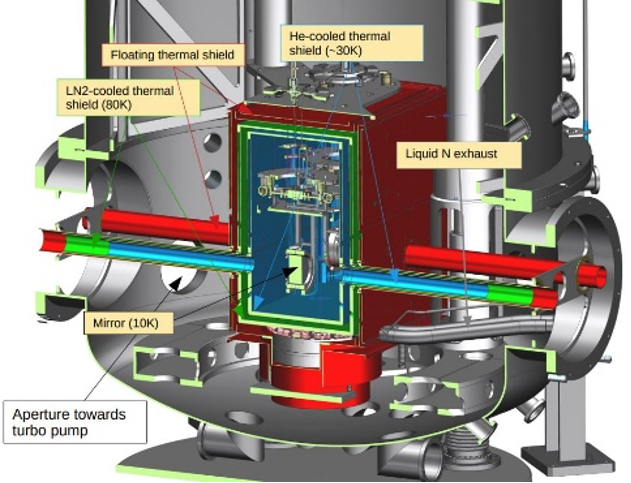
The figure below shows a cross section of the bottom of a mirror tower with cryogenic shields and mirrors. The cooling strategy is as follows: First of all, the shield (in green) will be cooled, followed by the helium-cooled shield (in blue). The assumption is that a lower pressure will exist at the mirror surfaces; therefore, the water molecules will migrate to the cooler, nitrogen-cooled surfaces.
Verification and Validation of Ultrahigh Vacuum Simulations
So far, only calculations with a ray tracing code have been made, written by H.J. Bulten, a Nikhef employee and physicist. Even though the results of the simulations have been very promising, the ray tracing code has not been compared to other software packages yet. A study was started with the aim to find a reliable calculation method for the pressure in the ultrahigh vacuum system of the ETpathfinder.
Before calculations on the actual ETpathfinder take place, the COMSOL Multiphysics® software was verified using measurements on an ultrahigh vacuum setup. This was already available at Nikhef, and forms the first part of the study.
The next step was to investigate how long the ETpathfinder needs to be heated during the evacuation of gases to reach the 10-9 mbar vacuum after the system had been opened for maintenance or research.
As a final step, the effect of a cooling strategy on the coverage rate of the monolayer of water molecules on the mirror surface (after it has been cooled to 10 K) was investigated.
Step 1
Verification of Theoretical Models
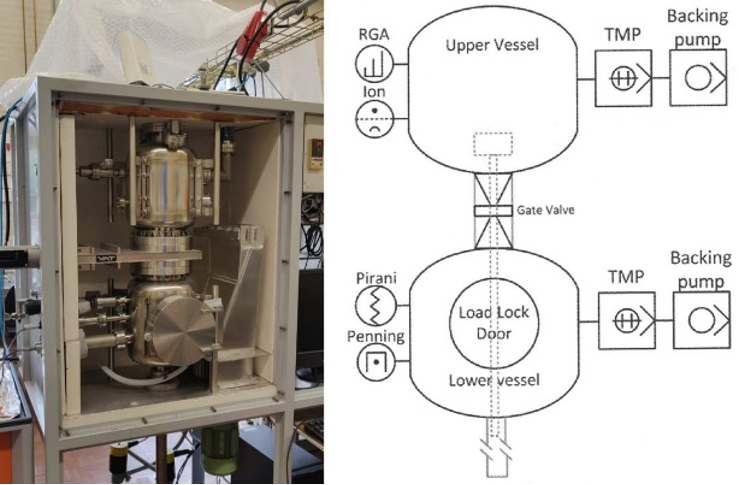
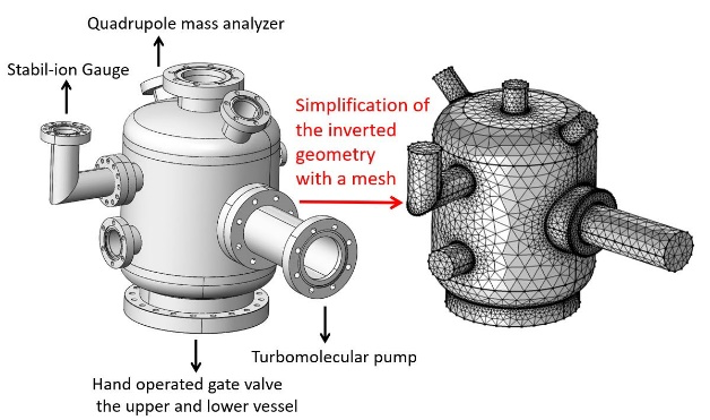
To verify the ray tracing code measurements were made using an ultrahigh vacuum setup, see the figure below. The measurements were compared to the ray tracing code and a simulation using the Molecular Flow Module, an add-on to COMSOL Multiphysics.
The ultrahigh vacuum setup is designed to investigate the outgassing of different materials. It can be heated up to 423 K. It consists of two chambers:
- Lower chamber, which has a door to load the test specimen and is sealed by an O-ring
- Upper chamber, which contains the quadrupole mass spectrometer (RGA) and Stabil-ion gauge
It is expected that approximately 1.2·10-14 mol/s of water molecules will enter the upper chamber. This estimate is based on:
- The surface area and permeation constant of the Viton O-rings at the loading door
- The fact that there is a manually operated valve between the chambers
- The fact that the pressure in the upper chamber is lower than in the other chamber
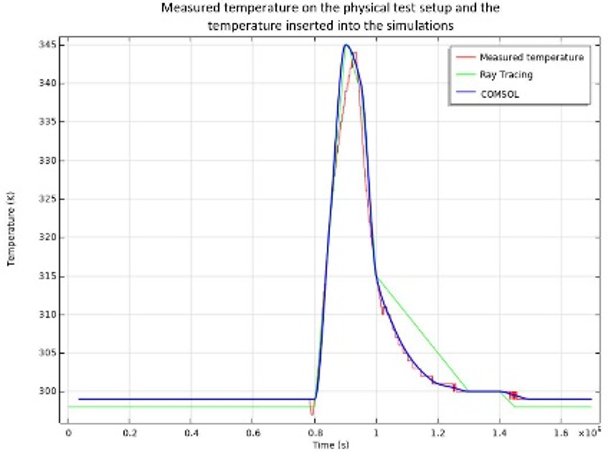
Before the setup is put into operation, it is aerated, followed by 22 hours of vacuum pump time. After that, the system is heated from 299 K to 344 K. The latter is done by circulating warm air between the outside of the vacuum chambers and the insulated protective cover.
The temperature is recorded and is shown in the figure below. The figure also includes the temperature history as inserted into the ray tracing code and COMSOL Multiphysics.
Theoretical Background and Parameters of Vacuum Setup
Molecular flow is a special form of flow calculation. The free path length of the particles in ultrahigh vacuum is much larger than the dimensions of the vacuum vessel itself (Knudsen’s number > 10). The pressure is calculated as collisions against the walls instead of collisions between the particles themselves. As a result, modeling the interior space and the structure of the vessel is not important: It suffices to only account for the internal geometry of the walls. The figure below depicts the ultrahigh vacuum setup and, on the right, the mesh for the calculation.
The probability that a particle colliding with the surface is adsorbed rather than reflected (sticking factor) depends on the coverage of the monolayer during a specific time step. The sticking factor is a number between 0 and 1 (with 1 being the 100% probability of binding with the surface) and is calculated using the formula:
The sticking coefficient (sc) is set to 0.2, based on literature and expertise. nadsorption(mol/m2) is the number density of adsorbed particles on the surface and is calculated by COMSOL Multiphysics in every time step. nsites (mol/m2) is the maximum number of molecules in the monolayer on the surface and set to 6.0·10-5 mol/m2.
In the model, it is assumed that adsorbed water molecules do not dissociate on the surface, so the rate of desorption of molecules from the surface Γ (mol/m2/s) depends on the residence time (τ) and the density of adsorbed molecules:
In an isothermal process, τ is a constant value. However, in this case, the temperature will increase and it is necessary to calculate τ per time step
Here, f is the natural oscillation frequency of a particle bound on the metal (1.0·1013 Hz), the universal gas constant R (8.314 J/(mol K)), the temperature T (K), and the binding energy Eb (J/mol). The binding energy depends on the surface roughness of a material. A range of values, from 0.9 eV (86.840 kJ/mol) to 1.10 eV (106.130 kJ/mol), with intervals of 0.05, were chosen for the calculations.
Results
Measurement and the simulation results are shown in the figure below. Both the COMSOL Multiphysics simulation and the ray tracing code predict a lower pressure at the end of the heating cycle than the measurements with the Stabil-ion gauge indicate.
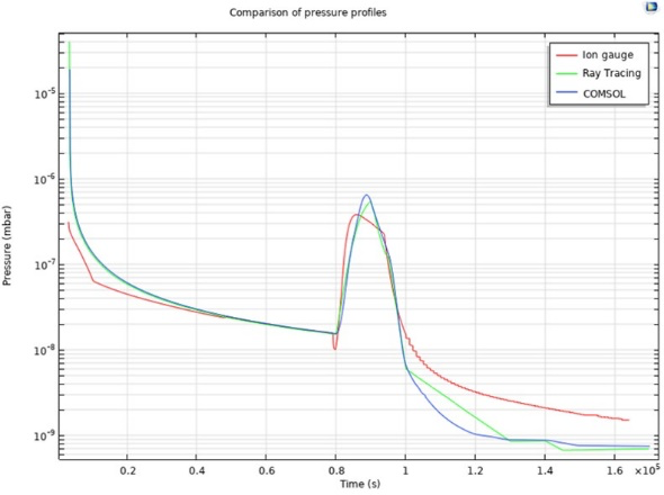
Repeated measurements with different time durations and different temperatures gave similar results. The conclusion is that the pressure in the ultrahigh vacuum setup decreases slower than the standard degassing curves found in literature seem to predict. The reason may be that the vacuum chamber actually has a larger surface area. For example, the measuring instruments, valves, and vanes on the turbomolecular pump may have significant contributions. Also, the permeation of the O-rings is uncertain and the overall heating may not be uniform. As a result, the outgassing of the wall may be lower at some places than the theoretical model predicts.
In literature, ranges of binding energies from 0.83 eV to 0.95 eV are mentioned. However, comparing the simulation results to the measured data from the vacuum setup, it is clear that there is more agreement with the simulations when higher binding energies are used. This indicates that, in practice, there is a lower outgassing than theoretically predicted.
Step 2
Geometry and Parameters of the ETpathfinder
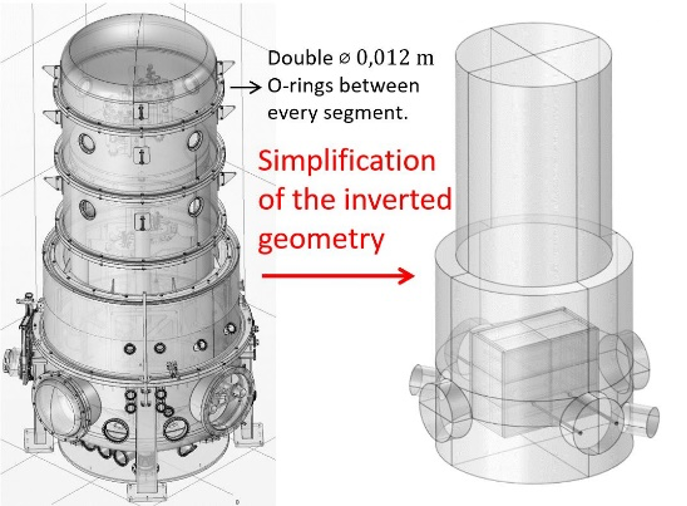
For a practical simulation of the ETpathfinder, its geometry must be simplified — just as in the case of the ultrahigh vacuum setup. The figure below shows which far-reaching simplifications were made. In reality, all three shields consist of double plates where the holes are not concentric with respect to each other. In the model, these are three single shields where the holes have been replaced by slots. These slots are located in the inner shield at the bottom and in the second shield at the top.

The figure below shows a CAD model of the full mirror tower, on the left, and a simplified model on the right where the geometry has been inverted to reflect the internal volume.
Some additional information on the ETpathfinder: It contains thirteen turbomolecular pumps (3200 l/s) and prepumps. It is expected that for an area of 87.6 m2, there will be a permeation of 1.5·10-11 mol/m2 through the double differentially pumped O-rings, with a pressure between these O-rings of 1 mbar.
Firing (Heating) of the ETpathfinder
After the mirror towers are opened, a pressure of 10-9 mbar must be achieved. Seven simulations with different firing times were performed to determine how long the ETpathfinder’s mirror towers should be heated. The results are shown in the figure below.
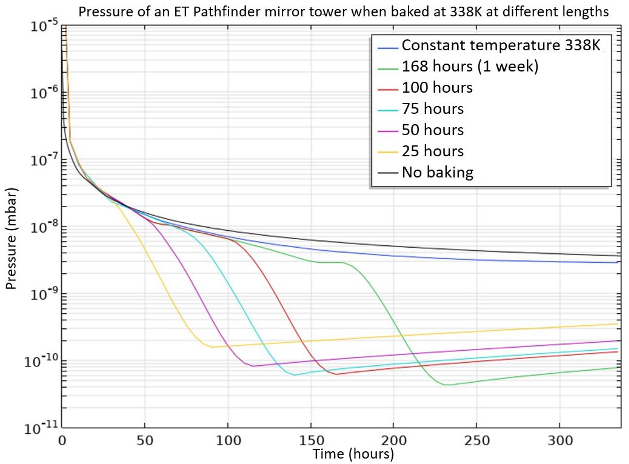
Despite having reached a pressure well below the 10-9 mbar design goal after 25 hours of firing, a large part of the monolayer had not gassed out. That took as much as 168 hours or a whole week of firing. Based on these results, the recommendation is to allow the firing for at least one week.
Step 3
Testing the Current Cooling Strategy
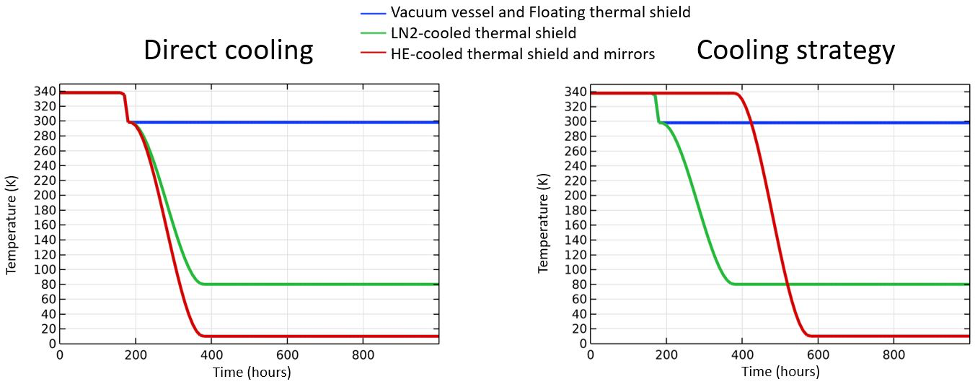
To analyze the effect of the cooling strategy, two situations are simulated:
- Direct cooling after the firing (left in the figure below)
- Inner shield and mirror surface remain at 338 K for a longer time, while the second shield cools to 80 K (right in the figure below)
Direct cooling leaves 3.333% of the monolayer on the mirror surface, and the cooling strategy leaves 0.068% (factor of 38). Covering the second shield was also investigated but had less effect than expected.
Conclusion
The simulations helped to gain confidence in the cooling strategy. However, assumptions were of course made for the simulations, and it is important to be critical of the results. Achieving a pressure of 10-9 mbar is a true challenge because of factors such as:
- Uniform heating and cooling
- Permeation by O-rings
- Surface roughness
- Microscopic contamination
The simulations gave good insight on the expected pumping curve of a specific situation, but the theoretical models are an optimistic representation of reality.
As Karl Jousten described in his conclusion in a paper on thermal degassing: “At the end of this review, it should be noted that the outgassing of materials both in theory and experiment is a very vivid subject, heavily discussed, and very complex, and there is still much to learn about it.”
Ultrahigh vacuum engineering is a highly specialized field in which there are many unknown aspects at the microscopic level. Partly because of these unknowns, creating a realistic simulation is a major challenge. Software packages such as COMSOL Multiphysics are impressive for the capabilities and computational power they offer.
Special thanks to the employees of Nikhef for providing me with the test setup and for sharing their expertise in vacuum technology during my internship. Also to the NEVAC for the opportunity to publish my research and the contributions they have made. Lastly, to COMSOL for being able to show my work in a guest blog post.
About the Author
Vera Erends is a mechanical engineering student at the University of Applied Sciences Utrecht, located in the Netherlands. She was first introduced to vacuum technology and molecular flow simulation during her internship at Nikhef in Amsterdam. Working closely with Nikhef employees, such as physicist Dr. H.J. Bulten and vacuum expert B. Munneke, resulted in successful research into free molecular flow of the ETpathfinder and her first publication.
References
- Het ontwerp van de grootste vacuüminstallatie op aarde: de Einstein Telescope, NEVAC blad 56-1 − maart 2018.
- ET Pathfinder team, ETpathfinder Design Report. Science Park, Amsterdam, The Netherlands (2020). www.etpathfinder.eu/wp-content/uploads/2020/03/ETpathfinder-Design-Report.pdf
- M. Ortino, “Sticking coefficients for technical materials”, master thesis, Politecnico Milano, CERN, Geneva, Switzerland, 2020. www.politesi.polimi.it/bitstream/10589/131905/1/Mattia%20Ortino%20Master%20Thesis.pdf
- COMSOL Multiphysics, Molecular Flow Module User’s Guide, ver. 5.4, 2018. doc.comsol.com/5.4/doc/com.comsol.help.molec/MolecularFlowModuleUsersGuide.pdf
- K. Jousten, “Thermal outgassing. Proceedings of the CERN Accelerator School”, Snekersten, Denmark, CERN report, S. Turner ed., pp. 111–125, 1999. cds.cern.ch/record/455558/files/open-2000-274.pdf


Comments (4)
Chandraprakash
August 24, 2021Thanks for sharing the insightful article. Can you please tell if the molecular flow module can account for the changes in the temperature as well?
regards,
Chandraprakash
Daniel Smith
September 23, 2021Excellent work Vera – thanks for sharing! One thing which might explain the different in results between the Stabil-ion gauge and COMSOL model (the second figure in the Step 1 section) is that an ion gauge doesn’t really measure pressure directly, it measures n*k*T, where n is the number density. The relation p=n*k*T doesn’t always hold at very low pressures, or if there are small view factors between the outgassing source and detector location. One thing you could try is to add a “Number Density Reconstruction” feature, and plot the result of n*k*T from the COMSOL model vs. the ion gauge measurements. Some background on this can be found in the “rotating_plate” Application Library example and the section “Experimental Measurements of Number Density/Pressure” in the Chapter 2 of the User’s Guide.
It could also be a practical issue with the experimental measurement. Hydrogen is very difficult to pump, so even if the initial gasses are very clean, there could be hydrogen or even carbon monoxide from the ion gauge filament contributing to the measured pressure. An RGA spectrum of the gas at pressures below 1E-8[mbar] would confirm this, but calibration might be an issue. It could be that you get better agreement if you only use the experimental partial pressure for water only.
Nguyen Kim Thanh Phong
July 7, 2023Great article,thank you very much for sharing this awesome post with us.
Teknik Informatika
March 1, 2024What are the key breakthrough discoveries in gravitational wave astronomy that have led to the development of the proposed Einstein Telescope (ET)?
Regard Telkom University