Discussion Closed This discussion was created more than 6 months ago and has been closed. To start a new discussion with a link back to this one, click here.
COMSOL export rounds frequency data in datapoint headers
Posted 26 feb 2025, 08:57 GMT-5 Results & Visualization Version 6.2 2 Replies

Please login with a confirmed email address before reporting spam
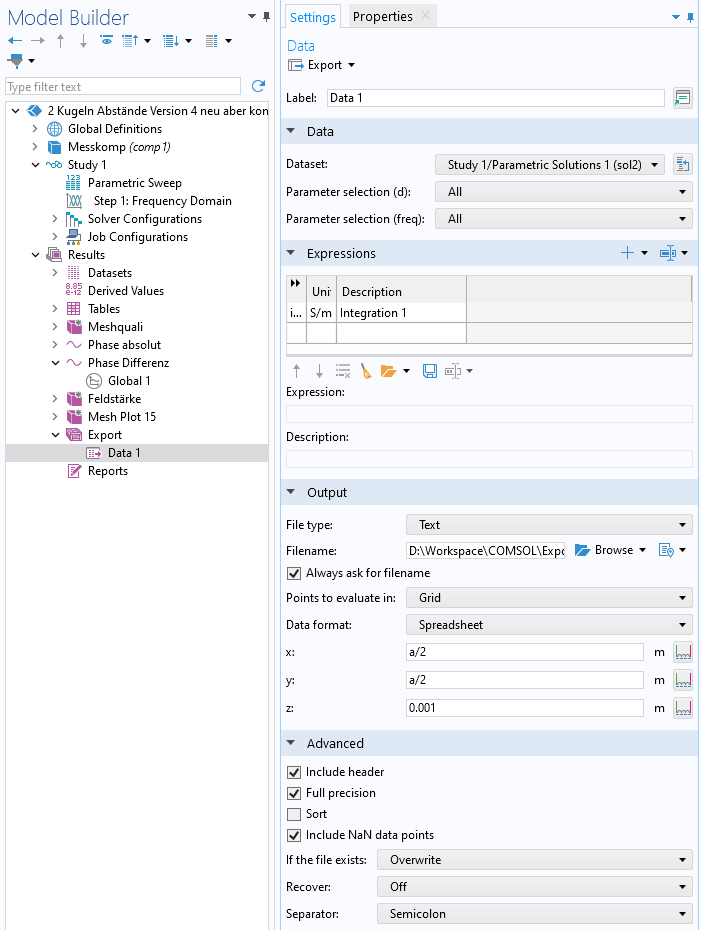
I did a study using frequency domain for different frequencies. Screenshot of setup:

When I plot the data inside, it looks fine.
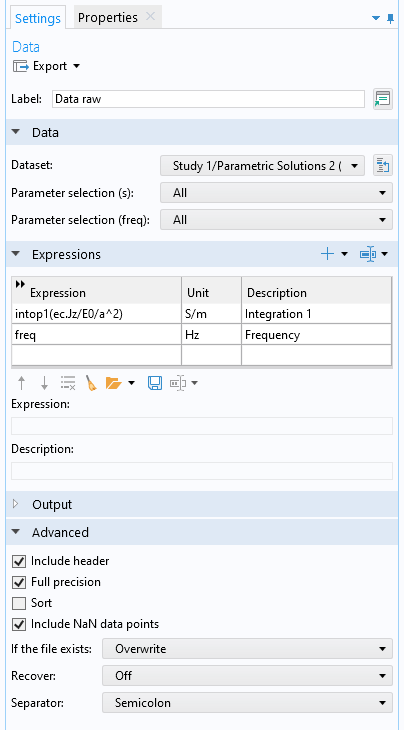
I exported the data as a .csv file with the "Full precision" setting on. However, this seems to only impact the values defined in the "expressions" section and not the frequency data.
The exported table contains datapoints inside the .csv table that are formatted like this:
intop1(ec.Jz/E0/a^2) (S/m) @ freq=1.2589E5, s=0.01 0.05118908008352398+5.732703179902605E-4i
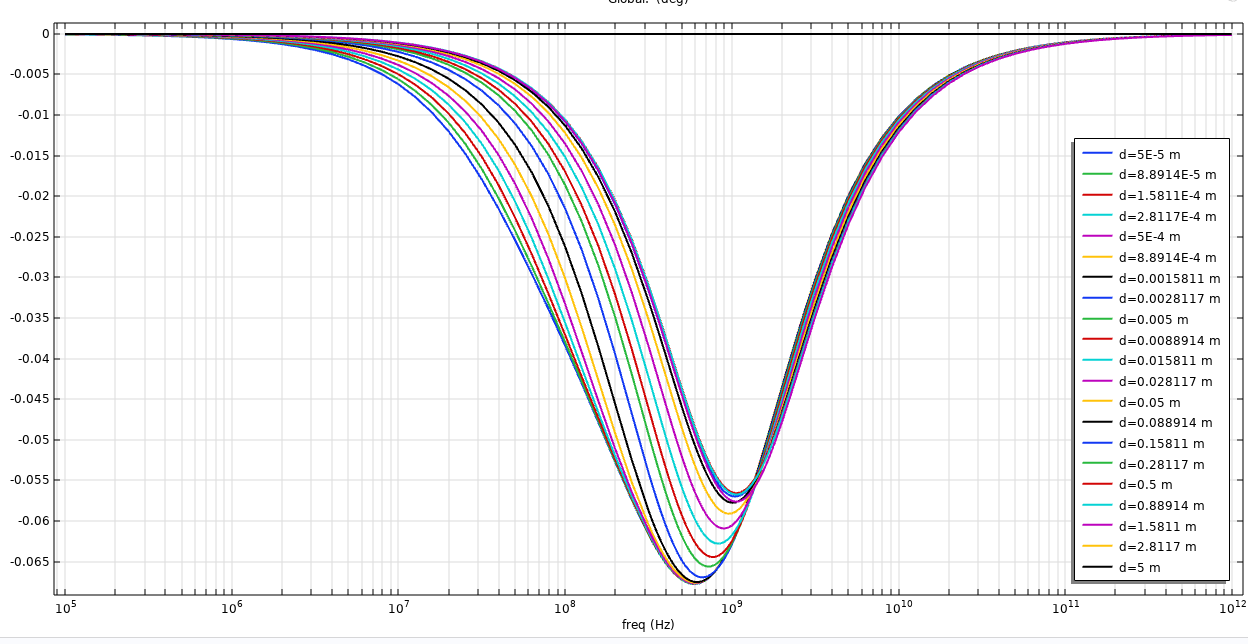
I used the "@ freq=1.2589E5" part of the datapoint header to read the frequencies. I plotted the data in python with the exact same operations performed on it, which resulted in the following graph, which looks bumpy:
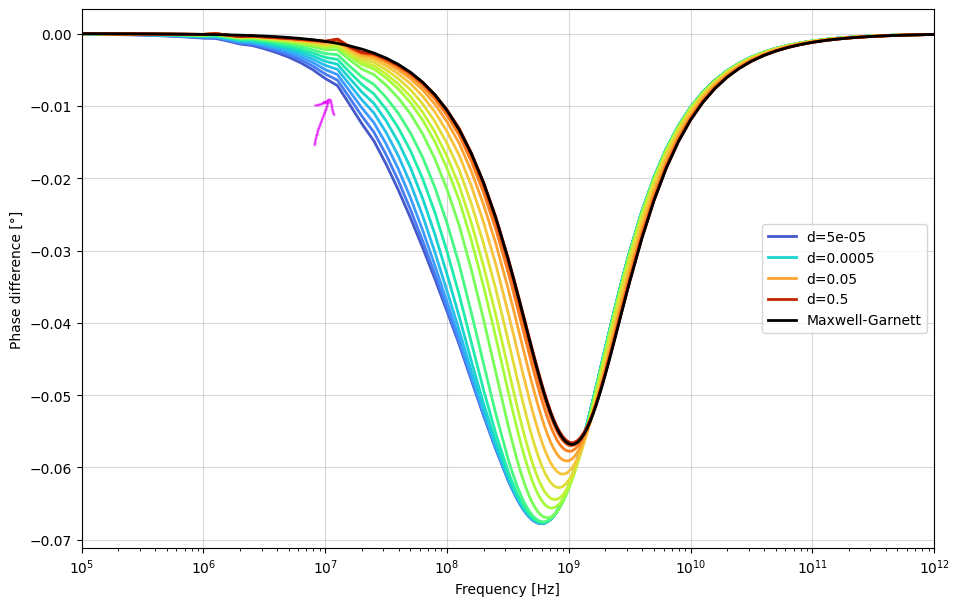
The reason for this is that the 5 decimal places of the frequency in the datapoint header were too imprecise for my use-case. The solution was to export not only the simulation results in the "expressions" tab, but also the frequency by just adding "freq" as an expression, which will export it with full accuracy. This is probably completely obvious to 99% of you, but I was so confused why my graph looked bumpy with the exported data.